Valuing a company effectively is key to making sound investment decisions, and tools like Fast Graphs simplify this process. Chuck Carnaval, co-founder of the Fundamentals Analyzer Software Tool (Fast Graphs), sheds light on evaluating FedEx Corporation's intrinsic value and understanding the relationship between stock price and earnings growth. Here's a breakdown of his insights.
Understanding Intrinsic Value with Fast Graphs
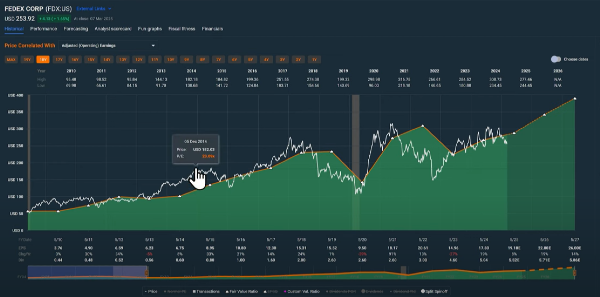
The Fast Graphs tool uses an orange line to represent the intrinsic value of a company, derived from a widely accepted formula. For FedEx, this line indicates a price-to-earnings (P/E) ratio of 15, serving as a benchmark to assess whether the stock is undervalued, overvalued, or fairly valued:
- Above the orange line: The stock is overvalued—poor timing to invest.
- Below the orange line: The stock is undervalued—excellent buying opportunity.
- Touching the orange line: The stock is at fair value.
FedEx's Earnings Growth: A Key Driver
FedEx has demonstrated an impressive earnings growth rate of 11.34% annually, increasing from $0.44 per share to a forecasted $26.04 per share by fiscal year-end May 2027. This growth underpins the fundamental relationship highlighted by Warren Buffett: “Price is what you pay, value is what you get.”
The stock price closely follows the orange line, reflecting operating earnings growth, albeit with volatility. This correlation underscores how earnings drive market prices over time.
Valuation and Investment Insights
Using FedEx as an example, Carnaval emphasizes the importance of buying at intrinsic value:
- Buy at fair value: Fully participate in the company’s growth.
- Buy below fair value: Earn returns exceeding the company’s growth rate.
- Buy above fair value: Participate in growth at a reduced rate.
Currently, FedEx is trading below its intrinsic value, making it a compelling prospect for value investors. Future earnings growth estimates exceeding 15% suggest continued potential for high returns.
The Role of Dividends
Fast Graphs also incorporates dividends into its analysis, depicted by a white line overlaying the orange line. FedEx pays a portion of its profits as dividends, reflected in the green shaded area. This tool helps investors assess both capital gains potential and dividend income.
Forecasting FedEx's Future Performance
By leveraging the Fast Graphs forecasting calculator, Carnaval highlights that FedEx’s intrinsic value line could average 15.47% growth in the coming years. This suggests a strong investment case, but as always, investors should perform their own due diligence and analysis.
Conclusion: A High-Level Look at FedEx**
With tools like Fast Graphs, investors can gain valuable insights into valuation dynamics. For FedEx, trading below its intrinsic value with strong projected growth, now might be a strategic time to consider adding the stock to your portfolio. Remember, informed decisions require running the numbers and conducting thorough research.
https://youtu.be/tvgW6s6Y-b4?si=5aXBolBkYavgO1jY


Valuing a company effectively is key to making sound investment decisions, and tools like Fast Graphs simplify this process. Chuck Carnaval, co-founder of the Fundamentals Analyzer Software Tool (Fast Graphs), sheds light on evaluating FedEx Corporation's intrinsic value and understanding the relationship between stock price and earnings growth. Here's a breakdown of his insights.
Understanding Intrinsic Value with Fast Graphs
The Fast Graphs tool uses an orange line to represent the intrinsic value of a company, derived from a widely accepted formula. For FedEx, this line indicates a price-to-earnings (P/E) ratio of 15, serving as a benchmark to assess whether the stock is undervalued, overvalued, or fairly valued:
FedEx's Earnings Growth: A Key Driver
FedEx has demonstrated an impressive earnings growth rate of 11.34% annually, increasing from $0.44 per share to a forecasted $26.04 per share by fiscal year-end May 2027. This growth underpins the fundamental relationship highlighted by Warren Buffett: “Price is what you pay, value is what you get.”
The stock price closely follows the orange line, reflecting operating earnings growth, albeit with volatility. This correlation underscores how earnings drive market prices over time.
Valuation and Investment Insights
Using FedEx as an example, Carnaval emphasizes the importance of buying at intrinsic value:
Currently, FedEx is trading below its intrinsic value, making it a compelling prospect for value investors. Future earnings growth estimates exceeding 15% suggest continued potential for high returns.
The Role of Dividends
Fast Graphs also incorporates dividends into its analysis, depicted by a white line overlaying the orange line. FedEx pays a portion of its profits as dividends, reflected in the green shaded area. This tool helps investors assess both capital gains potential and dividend income.
Forecasting FedEx's Future Performance
By leveraging the Fast Graphs forecasting calculator, Carnaval highlights that FedEx’s intrinsic value line could average 15.47% growth in the coming years. This suggests a strong investment case, but as always, investors should perform their own due diligence and analysis.
Conclusion: A High-Level Look at FedEx**
With tools like Fast Graphs, investors can gain valuable insights into valuation dynamics. For FedEx, trading below its intrinsic value with strong projected growth, now might be a strategic time to consider adding the stock to your portfolio. Remember, informed decisions require running the numbers and conducting thorough research.
https://youtu.be/tvgW6s6Y-b4?si=5aXBolBkYavgO1jY