Comparing VTI and VOO for Long-Term Portfolio Growth
Introduction
VTI and VOO are two of Vanguard’s most popular ETFs, offering investors exposure to U.S. equities with distinct strategies. VTI tracks the total U.S. stock market, including large-, mid-, and small-cap stocks, while VOO focuses solely on the S&P 500’s large-cap companies. Investors turn to these funds for long-term portfolio growth, but choosing between them depends on risk tolerance, diversification needs, and return expectations. Understanding their sector allocations, historical performance, and expense ratios can help determine which ETF best aligns with individual investment goals.
Understanding VTI and VOO
VTI and VOO are two of Vanguard’s most widely held ETFs, each offering distinct investment strategies. VTI tracks the CRSP US Total Market Index, providing exposure to large-, mid-, and small-cap stocks, while VOO follows the S&P 500 Index, focusing exclusively on large-cap companies. VTI’s sector allocation is broader, encompassing a wider range of industries, whereas VOO is more concentrated in sectors like technology, financial services, and healthcare. The primary difference between VTI and VOO lies in their holdings. VTI includes over 3,500 stocks, covering the entire U.S. equity market, while VOO is limited to approximately 500 large-cap stocks. This distinction means VTI captures growth opportunities from smaller companies that may eventually become large caps, whereas VOO focuses on established firms like Apple AAPL, Microsoft MSFT, and NVIDIA NVDA.
Historically, VOO has slightly outperformed VTI due to its concentration in large-cap stocks, which tend to be more resilient during economic downturns. Over the past decade, VOO has delivered an annualized return of approximately 12.81 percent, compared to VTI’s 12.13 percent. However, VTI’s broader exposure allows it to benefit from high-growth small-cap stocks, which can lead to stronger returns in bullish market conditions.
Sources:
Investing.com, Retire Before Dad, PortfoliosLab
Expense Ratios and Fees
VTI and VOO both maintain an exceptionally low expense ratio of 0.03 percent, making them cost-effective choices for long-term investors. This fee structure is significantly lower than the industry average, which typically ranges from 0.3 to 0.9 percent. The minimal expense ratio ensures that investors retain more of their returns over time. The impact of fees on long-term returns is crucial for portfolio growth. While both VTI and VOO have identical expense ratios, their differing compositions influence overall performance. VOO, which tracks the S&P 500, has historically delivered slightly higher returns due to its focus on large-cap stocks. VTI, encompassing the entire U.S. stock market, benefits from exposure to mid-cap and small-cap stocks, which can enhance returns during bullish market cycles.
For passive investors, cost efficiency is a key factor in ETF selection. VTI and VOO both provide broad market exposure with minimal fees, making them ideal for long-term wealth accumulation. Their passive management style ensures low turnover, reducing tax implications and transaction costs. Investors seeking a diversified, low-cost approach to stock market investing can confidently rely on either ETF, depending on their preference for total market exposure or large-cap stability.
Sources:
PortfoliosLab, Forbes, HedgeThink, Market Realist
Risk and Volatility Considerations
VTI and VOO both balance risk and reward by offering diversified exposure to the U.S. stock market, but their approaches differ. VTI includes mid-cap and small-cap stocks, which can introduce higher volatility but also greater growth potential. VOO, on the other hand, focuses exclusively on large-cap stocks, providing more stability during market downturns. Volatility trends indicate that VTI experiences slightly higher price fluctuations compared to VOO. Historical data shows that VTI has a daily standard deviation of 20.37 percent, whereas VOO maintains a lower volatility at 19.54 percent. Additionally, VTI’s maximum drawdown during market corrections has been deeper, reaching -55.45 percent, while VOO’s drawdown was less severe at -33.99 percent.
Case studies of VTI and VOO’s performance during market downturns reinforce their risk profiles. During the 2020 market crash, VTI declined more sharply due to its exposure to smaller stocks but rebounded strongly as the market recovered. VOO, with its large-cap focus, demonstrated resilience, recovering losses at a steadier pace. Similarly, in early 2025, VTI saw a 4.03 percent drawdown, while VOO experienced a milder 3.55 percent decline, further proving its stability during volatile periods.
Sources:
PortfoliosLab, Stock Analysis, Investing in the Web
Growth Potential and Returns
VTI and VOO have both demonstrated strong long-term returns, but their performance varies due to differences in market exposure. Over the past decade, VOO has delivered an annualized return of approximately 12.81 percent, slightly outperforming VTI’s 12.13 percent. This difference is largely attributed to VOO’s focus on large-cap stocks, which tend to be more stable and resilient during economic downturns. Sector-wise analysis highlights key growth opportunities in both ETFs. VOO is heavily weighted toward technology, financial services, and healthcare, with companies like Apple AAPL, Microsoft MSFT, and NVIDIA NVDA driving its performance. VTI, while also holding these large-cap stocks, includes mid-cap and small-cap companies that provide additional growth potential.
Predictions for future performance suggest continued strength for both ETFs. Analysts forecast that VOO will maintain steady growth, driven by corporate earnings and economic stability. VTI, with its broader market exposure, is expected to experience higher volatility but may outperform VOO in strong market conditions.
Sources:
Stock Analysis, Investing in the Web, 24/7 Wall St.
Institutional and Retail Investor Sentiment
Institutional investors continue to favor both VTI and VOO, with billions of dollars allocated to these ETFs. VOO, tracking the S&P 500, remains a staple for large financial firms and pension funds due to its stability and predictable returns. VTI, offering exposure to the entire U.S. stock market, attracts institutions seeking broader diversification. Recent data indicates that institutional holdings in VOO exceed $355 billion, while VTI maintains approximately $329 billion in assets under management. Retail investors often choose between VTI and VOO based on their risk tolerance and investment goals. Those seeking broad market exposure prefer VTI, as it includes mid-cap and small-cap stocks alongside large-cap companies. Investors prioritizing stability and blue-chip stocks lean toward VOO, which focuses exclusively on the S&P 500.
The growing popularity of passive investing has led to increased retail participation in both ETFs, with VTI appealing to those looking for higher growth potential and VOO favored by investors seeking lower volatility. Experts predict continued strong performance for both ETFs, though their future trajectories may differ. The choice between these ETFs ultimately depends on an investor’s preference for diversification versus stability.
Sources:
PortfoliosLab, Stock Analysis, Investing in the Web
Portfolio Allocation Strategies
Integrating VTI or VOO into a diversified portfolio requires careful allocation to balance risk and reward. VTI provides exposure to the entire U.S. stock market, including mid-cap and small-cap stocks, while VOO focuses exclusively on large-cap companies. Investors often combine VTI with fixed-income assets or international ETFs to enhance diversification. Balancing VTI with sector-specific ETFs allows investors to target high-growth industries while maintaining overall market exposure. Some investors pair VTI with technology-focused ETFs like QQQ or healthcare ETFs to capitalize on emerging trends. VOO, with its large-cap focus, can be complemented by mid-cap or small-cap ETFs to capture additional growth potential.
Investors often use dollar-cost averaging to reduce the impact of market fluctuations while reinvesting dividends to compound returns. Additionally, maintaining a diversified asset allocation and adjusting holdings based on economic conditions can enhance portfolio performance.
Sources:
Stock Analysis, Forbes, PortfoliosLab
Conclusion
VTI and VOO are both strong ETF choices for long-term investing, but their differences cater to distinct investor needs. VTI’s broad market exposure includes mid-cap and small-cap stocks, offering diversification and higher growth potential, while VOO focuses on large-cap stability, making it a reliable choice for those seeking lower volatility. Institutional and retail investors alike continue to allocate funds to both ETFs, recognizing their efficiency, low fees, and historical performance. The decision ultimately depends on an investor’s risk tolerance and financial strategy, with VTI offering wider market representation and VOO providing steady growth anchored in blue-chip companies.
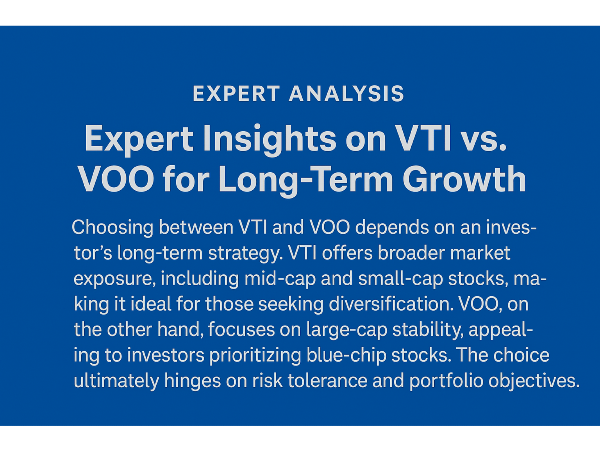
Expert Analysis: Expert Insights on VTI vs. VOO for Long-Term Growth
Choosing between VTI and VOO depends on an investor’s long-term strategy. VTI offers broader market exposure, including mid-cap and small-cap stocks, making it ideal for those seeking diversification. VOO, on the other hand, focuses on large-cap stability, appealing to investors prioritizing blue-chip stocks. The choice ultimately hinges on risk tolerance and portfolio objectives.
📌Read More:
Top Large Cap Stocks- https://stockbossup.com/pages/topics/large-cap
Why is VOO So Popular?- https://stockbossup.com/pages/post/38754/why-is-voo-so-popular
What is VTI and VOO?- https://stockbossup.com/pages/post/38634/what-is-vti-and-voo
Why VOO Over SPY?- https://stockbossup.com/pages/post/39131/voo-vs-spy-which-s-p-500-etf-offers-better-long-term-value
Is a SCHD or VOO Better?- https://stockbossup.com/pages/post/38645/is-a-schd-or-voo-better


















Comparing VTI and VOO for Long-Term Portfolio Growth
Introduction
VTI and VOO are two of Vanguard’s most popular ETFs, offering investors exposure to U.S. equities with distinct strategies. VTI tracks the total U.S. stock market, including large-, mid-, and small-cap stocks, while VOO focuses solely on the S&P 500’s large-cap companies. Investors turn to these funds for long-term portfolio growth, but choosing between them depends on risk tolerance, diversification needs, and return expectations. Understanding their sector allocations, historical performance, and expense ratios can help determine which ETF best aligns with individual investment goals.
Understanding VTI and VOO
VTI and VOO are two of Vanguard’s most widely held ETFs, each offering distinct investment strategies. VTI tracks the CRSP US Total Market Index, providing exposure to large-, mid-, and small-cap stocks, while VOO follows the S&P 500 Index, focusing exclusively on large-cap companies. VTI’s sector allocation is broader, encompassing a wider range of industries, whereas VOO is more concentrated in sectors like technology, financial services, and healthcare. The primary difference between VTI and VOO lies in their holdings. VTI includes over 3,500 stocks, covering the entire U.S. equity market, while VOO is limited to approximately 500 large-cap stocks. This distinction means VTI captures growth opportunities from smaller companies that may eventually become large caps, whereas VOO focuses on established firms like Apple AAPL, Microsoft MSFT, and NVIDIA NVDA.
Historically, VOO has slightly outperformed VTI due to its concentration in large-cap stocks, which tend to be more resilient during economic downturns. Over the past decade, VOO has delivered an annualized return of approximately 12.81 percent, compared to VTI’s 12.13 percent. However, VTI’s broader exposure allows it to benefit from high-growth small-cap stocks, which can lead to stronger returns in bullish market conditions.
Sources:
Investing.com, Retire Before Dad, PortfoliosLab
Expense Ratios and Fees
VTI and VOO both maintain an exceptionally low expense ratio of 0.03 percent, making them cost-effective choices for long-term investors. This fee structure is significantly lower than the industry average, which typically ranges from 0.3 to 0.9 percent. The minimal expense ratio ensures that investors retain more of their returns over time. The impact of fees on long-term returns is crucial for portfolio growth. While both VTI and VOO have identical expense ratios, their differing compositions influence overall performance. VOO, which tracks the S&P 500, has historically delivered slightly higher returns due to its focus on large-cap stocks. VTI, encompassing the entire U.S. stock market, benefits from exposure to mid-cap and small-cap stocks, which can enhance returns during bullish market cycles.
For passive investors, cost efficiency is a key factor in ETF selection. VTI and VOO both provide broad market exposure with minimal fees, making them ideal for long-term wealth accumulation. Their passive management style ensures low turnover, reducing tax implications and transaction costs. Investors seeking a diversified, low-cost approach to stock market investing can confidently rely on either ETF, depending on their preference for total market exposure or large-cap stability.
Sources: PortfoliosLab, Forbes, HedgeThink, Market Realist
Risk and Volatility Considerations
VTI and VOO both balance risk and reward by offering diversified exposure to the U.S. stock market, but their approaches differ. VTI includes mid-cap and small-cap stocks, which can introduce higher volatility but also greater growth potential. VOO, on the other hand, focuses exclusively on large-cap stocks, providing more stability during market downturns. Volatility trends indicate that VTI experiences slightly higher price fluctuations compared to VOO. Historical data shows that VTI has a daily standard deviation of 20.37 percent, whereas VOO maintains a lower volatility at 19.54 percent. Additionally, VTI’s maximum drawdown during market corrections has been deeper, reaching -55.45 percent, while VOO’s drawdown was less severe at -33.99 percent.
Case studies of VTI and VOO’s performance during market downturns reinforce their risk profiles. During the 2020 market crash, VTI declined more sharply due to its exposure to smaller stocks but rebounded strongly as the market recovered. VOO, with its large-cap focus, demonstrated resilience, recovering losses at a steadier pace. Similarly, in early 2025, VTI saw a 4.03 percent drawdown, while VOO experienced a milder 3.55 percent decline, further proving its stability during volatile periods.
Sources:
PortfoliosLab, Stock Analysis, Investing in the Web
Growth Potential and Returns
VTI and VOO have both demonstrated strong long-term returns, but their performance varies due to differences in market exposure. Over the past decade, VOO has delivered an annualized return of approximately 12.81 percent, slightly outperforming VTI’s 12.13 percent. This difference is largely attributed to VOO’s focus on large-cap stocks, which tend to be more stable and resilient during economic downturns. Sector-wise analysis highlights key growth opportunities in both ETFs. VOO is heavily weighted toward technology, financial services, and healthcare, with companies like Apple AAPL, Microsoft MSFT, and NVIDIA NVDA driving its performance. VTI, while also holding these large-cap stocks, includes mid-cap and small-cap companies that provide additional growth potential.
Predictions for future performance suggest continued strength for both ETFs. Analysts forecast that VOO will maintain steady growth, driven by corporate earnings and economic stability. VTI, with its broader market exposure, is expected to experience higher volatility but may outperform VOO in strong market conditions.
Sources:
Stock Analysis, Investing in the Web, 24/7 Wall St.
Institutional and Retail Investor Sentiment
Institutional investors continue to favor both VTI and VOO, with billions of dollars allocated to these ETFs. VOO, tracking the S&P 500, remains a staple for large financial firms and pension funds due to its stability and predictable returns. VTI, offering exposure to the entire U.S. stock market, attracts institutions seeking broader diversification. Recent data indicates that institutional holdings in VOO exceed $355 billion, while VTI maintains approximately $329 billion in assets under management. Retail investors often choose between VTI and VOO based on their risk tolerance and investment goals. Those seeking broad market exposure prefer VTI, as it includes mid-cap and small-cap stocks alongside large-cap companies. Investors prioritizing stability and blue-chip stocks lean toward VOO, which focuses exclusively on the S&P 500.
The growing popularity of passive investing has led to increased retail participation in both ETFs, with VTI appealing to those looking for higher growth potential and VOO favored by investors seeking lower volatility. Experts predict continued strong performance for both ETFs, though their future trajectories may differ. The choice between these ETFs ultimately depends on an investor’s preference for diversification versus stability.
Sources:
PortfoliosLab, Stock Analysis, Investing in the Web
Portfolio Allocation Strategies
Integrating VTI or VOO into a diversified portfolio requires careful allocation to balance risk and reward. VTI provides exposure to the entire U.S. stock market, including mid-cap and small-cap stocks, while VOO focuses exclusively on large-cap companies. Investors often combine VTI with fixed-income assets or international ETFs to enhance diversification. Balancing VTI with sector-specific ETFs allows investors to target high-growth industries while maintaining overall market exposure. Some investors pair VTI with technology-focused ETFs like QQQ or healthcare ETFs to capitalize on emerging trends. VOO, with its large-cap focus, can be complemented by mid-cap or small-cap ETFs to capture additional growth potential.
Investors often use dollar-cost averaging to reduce the impact of market fluctuations while reinvesting dividends to compound returns. Additionally, maintaining a diversified asset allocation and adjusting holdings based on economic conditions can enhance portfolio performance.
Sources:
Stock Analysis, Forbes, PortfoliosLab
Conclusion
VTI and VOO are both strong ETF choices for long-term investing, but their differences cater to distinct investor needs. VTI’s broad market exposure includes mid-cap and small-cap stocks, offering diversification and higher growth potential, while VOO focuses on large-cap stability, making it a reliable choice for those seeking lower volatility. Institutional and retail investors alike continue to allocate funds to both ETFs, recognizing their efficiency, low fees, and historical performance. The decision ultimately depends on an investor’s risk tolerance and financial strategy, with VTI offering wider market representation and VOO providing steady growth anchored in blue-chip companies.
Expert Analysis: Expert Insights on VTI vs. VOO for Long-Term Growth
Choosing between VTI and VOO depends on an investor’s long-term strategy. VTI offers broader market exposure, including mid-cap and small-cap stocks, making it ideal for those seeking diversification. VOO, on the other hand, focuses on large-cap stability, appealing to investors prioritizing blue-chip stocks. The choice ultimately hinges on risk tolerance and portfolio objectives.
📌Read More:
Top Large Cap Stocks- https://stockbossup.com/pages/topics/large-cap
Why is VOO So Popular?- https://stockbossup.com/pages/post/38754/why-is-voo-so-popular
What is VTI and VOO?- https://stockbossup.com/pages/post/38634/what-is-vti-and-voo
Why VOO Over SPY?- https://stockbossup.com/pages/post/39131/voo-vs-spy-which-s-p-500-etf-offers-better-long-term-value
Is a SCHD or VOO Better?- https://stockbossup.com/pages/post/38645/is-a-schd-or-voo-better