How do You Value a Stock?
Value investing is a time-tested, proven strategy that works over the long term. To value a stock, you need to follow three steps:
- Evaluate if the company can continue growing.
- Calculate the intrinsic value of the stock.
- Determine if the stock price is below this intrinsic value minus your risk factor.
Value investing is a continuous process. These three steps should be repeated at least quarterly so that you can discover new investment opportunities and reassess your current portfolio.
How do you Find a Stock to Evaluate?
Based on the book The Little Book that Still Beats the Market, the best way to find stock opportunities is to find stocks with the highest return on capital and the highest earnings to enterprise value. You can find a list of candidates at magicformulainvesting.com.
How do you Evaluate a stock Before Buying?
Before crunching any numbers, evaluate if a company has continued growth prospects. Start by seeing if they have historically been growing. Even the fastest growth stock takes years to grow.
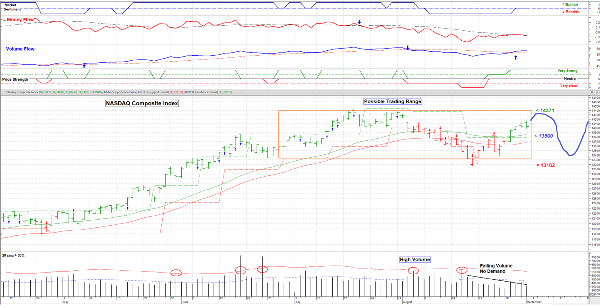
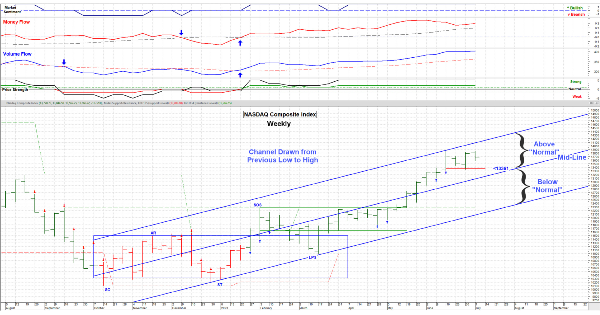
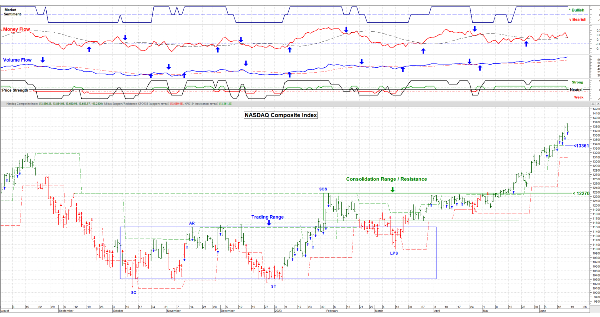
A great tool to evaluate a stock is to use the Stock Selection Guide (SSG). The SSG looks for stocks whose earnings and price are up, straight, and parallel on a logarithmic price chart.
You should then check the resilience of the company. Check the following about the company:
- What is their moat? Why aren’t competitors eating away their profits? For manufacturing, this could be a large capital equipment investment to manufacture the product. For a railroad like Union Pacific (UNP), the company has an oligopoly on railroad networks in the United States west. It is difficult for competitors to build the same railroad network in that area.
- Is the growth strategy realistic? Companies that do not have a growth strategy run the risk of underperforming. The company must have a plan to expand into new markets. Does the management’s plan have a real path to success?
- Is Management Driving Performance? Companies use metrics to drive earnings in the company. Are these industry specific metrics relevant to drive more revenue and earnings? Are these specific metrics improving each quarter? For example, Union Pacific’s key performance metrics are freight car velocity and the percentage of train cars on time. These metrics are critical to Union Pacific’s earnings growth.
What is a Value Trap?
A value trap is a false positive signal to buy a stock based on quantitative analysis alone. This is why evaluating a company’s growth potential before buying a stock is critical before conducting a quantitative analysis.
A value trap occurs because an established company faces market pressures from new sources of competition. The company may be struggling because of new technologies subverting its market domination, or because competitors are simply beating them in the marketplace.
A classic example is Bed Bath & Beyond. This company had solid historical earnings and cash flow, but it failed to adapt rapidly to price pressures from its box-store competitors and online rivals like Amazon (AMZN).
It is critical to evaluate if a company’s established moat can be maintained, or if competitors are threatening to overtake the company’s competitive advantage.
What is the Formula for Valuation?
The intrinsic value of a stock is the book value per share plus the discounted forecasted earnings over ten years. The discount rate is the current 10-year t-note.
The most difficult part of this calculation is the earnings growth estimate. A reasonable estimate is the previous 10-year earnings growth; however, the growth rate may be declining if the company is in its mature growth stage.
When you graph the intrinsic value versus the stock’s two-year growth, many established stocks have a strong correlation between an undervalued intrinsic value and stock appreciation over a two-year period.
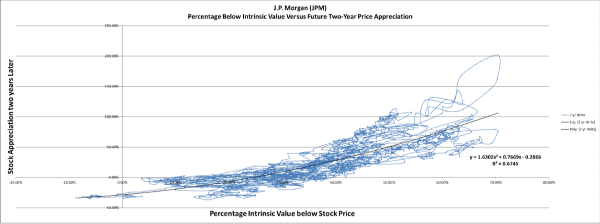
In the graph below, the intrinsic value of J.P. Morgan is graphed versus its stock price. As you can see, JPM follows a consistent trend between intrinsic value and 2-year price appreciation.
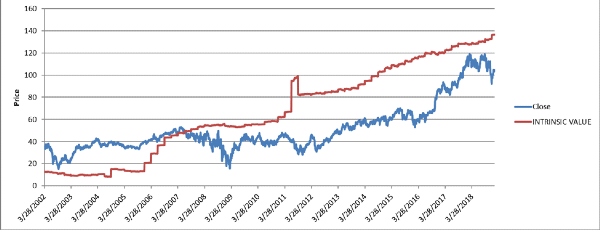
In the 2000’s, JP Morgan was valued consistently higher than its intrinsic value. This was caused by the market’s risk factor. The stock market gave bank stocks a low risk factor and accepted a premium for buying bank stocks.
After the 2009 financial crisis, the price of bank stocks fell below the bank’s intrinsic value. This can be seen in the graph above. The market stopped buying bank stops at a premium. The market placed a high-risk factor on banks so that the price now trades below the intrinsic value. This phenomenon also occurred in 2000 during the tech bubble. Tech stocks started trading with a higher risk factor after the tech bubble.
In general, if a specific sector caused a market correction, the stocks within that sector will trade below their intrinsic value. This is caused by the market giving these stocks a higher risk factor.
How do You Determine if a Stock is a Good buy?
You have determined the stock is well suited for continued growth. You’ve calculated the intrinsic value. Now you must determine if the stock is a good buy. The question boils down to what your risk factor should be. As we showed earlier, the market itself will adjust the risk factor of all the stocks in a given sector if that sector caused a market correction.
The point is that actual risk factors dictated by the market will change over time. For JP Morgan, a 30% risk factor gives a high probability of price appreciation in the next two years. This risk factor has worked very well after the 2009 financial crisis up until 2019, with a near perfect record of stock appreciation.
If you put your risk factor at 40% for JP Morgan, you can see that JP Morgan has consistently appreciated 50% from that price point! So why not just wait until you reach this 40% risk factor? Well, the truth is that JP Morgan rarely falls to these levels.
Choosing a risk factor is a balance between better bargain prices and risk of inaction.
For a stock with proven growth, a recommended strategy is as follows:
- Buy and hold a quarter of the position you want to have in the company.
- Buy another quarter if the stock falls below its intrinsic value.
- Buy another quarter if the stock falls below the risk factor.
- Buy the final quarter if the stock falls even further below your risk factor.
When a stock falls below your risk factor, you need to be prepared to act swiftly. You may only have days to act, and you may miss your opportunity if a market circuit breaker is hit. You need to be confident in your assessment of the company. If you’re wrong, and the company has real issues, you may be buying a collapsing company. Be sure you understand why the price is falling. You need to know if irrational fear is driving the price down or if the price correction is due to genuine concern over the company’s health.
What is a Good P/E Ratio?
For value investing, the P/E ratio only gives you a cross-section of the stock’s intrinsic value. For typical stocks, a good P/E ratio will vary depending on the stock sector. The P/E ratio doesn’t take into account the company’s assets, its earnings growth, or interest rates. Using these additional variables gives a clear picture of the company’s value.
https://youtu.be/i3Uc90leKCU


How do You Value a Stock?
Value investing is a time-tested, proven strategy that works over the long term. To value a stock, you need to follow three steps:
Value investing is a continuous process. These three steps should be repeated at least quarterly so that you can discover new investment opportunities and reassess your current portfolio.
How do you Find a Stock to Evaluate?
Based on the book The Little Book that Still Beats the Market, the best way to find stock opportunities is to find stocks with the highest return on capital and the highest earnings to enterprise value. You can find a list of candidates at magicformulainvesting.com.
How do you Evaluate a stock Before Buying?
Before crunching any numbers, evaluate if a company has continued growth prospects. Start by seeing if they have historically been growing. Even the fastest growth stock takes years to grow.
A great tool to evaluate a stock is to use the Stock Selection Guide (SSG). The SSG looks for stocks whose earnings and price are up, straight, and parallel on a logarithmic price chart.
You should then check the resilience of the company. Check the following about the company:
What is a Value Trap?
A value trap is a false positive signal to buy a stock based on quantitative analysis alone. This is why evaluating a company’s growth potential before buying a stock is critical before conducting a quantitative analysis.
A value trap occurs because an established company faces market pressures from new sources of competition. The company may be struggling because of new technologies subverting its market domination, or because competitors are simply beating them in the marketplace.
A classic example is Bed Bath & Beyond. This company had solid historical earnings and cash flow, but it failed to adapt rapidly to price pressures from its box-store competitors and online rivals like Amazon (AMZN).
It is critical to evaluate if a company’s established moat can be maintained, or if competitors are threatening to overtake the company’s competitive advantage.
What is the Formula for Valuation?
The intrinsic value of a stock is the book value per share plus the discounted forecasted earnings over ten years. The discount rate is the current 10-year t-note.
The most difficult part of this calculation is the earnings growth estimate. A reasonable estimate is the previous 10-year earnings growth; however, the growth rate may be declining if the company is in its mature growth stage.
When you graph the intrinsic value versus the stock’s two-year growth, many established stocks have a strong correlation between an undervalued intrinsic value and stock appreciation over a two-year period.
In the graph below, the intrinsic value of J.P. Morgan is graphed versus its stock price. As you can see, JPM follows a consistent trend between intrinsic value and 2-year price appreciation.
In the 2000’s, JP Morgan was valued consistently higher than its intrinsic value. This was caused by the market’s risk factor. The stock market gave bank stocks a low risk factor and accepted a premium for buying bank stocks.
After the 2009 financial crisis, the price of bank stocks fell below the bank’s intrinsic value. This can be seen in the graph above. The market stopped buying bank stops at a premium. The market placed a high-risk factor on banks so that the price now trades below the intrinsic value. This phenomenon also occurred in 2000 during the tech bubble. Tech stocks started trading with a higher risk factor after the tech bubble.
In general, if a specific sector caused a market correction, the stocks within that sector will trade below their intrinsic value. This is caused by the market giving these stocks a higher risk factor.
How do You Determine if a Stock is a Good buy?
You have determined the stock is well suited for continued growth. You’ve calculated the intrinsic value. Now you must determine if the stock is a good buy. The question boils down to what your risk factor should be. As we showed earlier, the market itself will adjust the risk factor of all the stocks in a given sector if that sector caused a market correction.
The point is that actual risk factors dictated by the market will change over time. For JP Morgan, a 30% risk factor gives a high probability of price appreciation in the next two years. This risk factor has worked very well after the 2009 financial crisis up until 2019, with a near perfect record of stock appreciation.
If you put your risk factor at 40% for JP Morgan, you can see that JP Morgan has consistently appreciated 50% from that price point! So why not just wait until you reach this 40% risk factor? Well, the truth is that JP Morgan rarely falls to these levels.
Choosing a risk factor is a balance between better bargain prices and risk of inaction.
For a stock with proven growth, a recommended strategy is as follows:
When a stock falls below your risk factor, you need to be prepared to act swiftly. You may only have days to act, and you may miss your opportunity if a market circuit breaker is hit. You need to be confident in your assessment of the company. If you’re wrong, and the company has real issues, you may be buying a collapsing company. Be sure you understand why the price is falling. You need to know if irrational fear is driving the price down or if the price correction is due to genuine concern over the company’s health.
What is a Good P/E Ratio?
For value investing, the P/E ratio only gives you a cross-section of the stock’s intrinsic value. For typical stocks, a good P/E ratio will vary depending on the stock sector. The P/E ratio doesn’t take into account the company’s assets, its earnings growth, or interest rates. Using these additional variables gives a clear picture of the company’s value.
https://youtu.be/i3Uc90leKCU