A $1,000 investment in Chipotle back in 2006? That'd be worth over $50,000 today. But here's where it gets even more interesting—Chipotle still plans to double its store count. So, are we late to the party, or is there still a seat at the table?
In this breakdown, we’ll walk through five years of Chipotle’s financials and a 10-year forecast model to see what kind of return investors might expect going forward. We’re working toward two key answers: a fair value price estimate and an annual return projection. And yes, it all wraps up with a star rating.
Let’s start from the beginning.
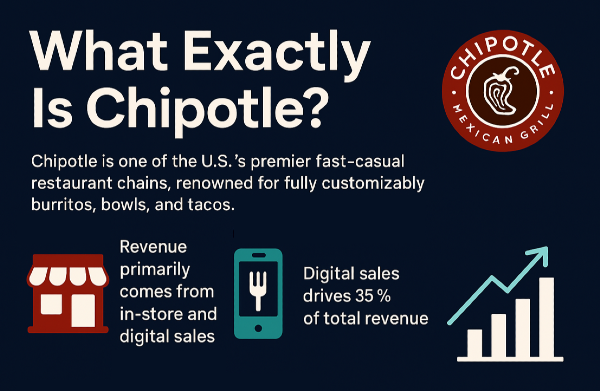
What Exactly Is Chipotle?
Chipotle is one of the U.S.'s premier fast-casual restaurant chains, renowned for fully customizable burritos, bowls, and tacos. Founded in 1993, the company has grown to operate over 3,000 locations—and that number’s expected to hit 7,000 in the next decade.
Here’s a major detail: every restaurant is company-owned. No franchises.
Revenue primarily comes from in-store and digital sales, the latter now driving more than 35% of total revenue. That digital push doesn’t just add convenience—it increases margins too. With its efficiency-first model, high-margin menu, and low food waste, Chipotle has become one of the fastest-growing and most profitable names in the S&P 500.
Financials Recap: How Has Chipotle Performed?
Before jumping into our forecast model, let’s recap historical performance using three key lenses: core financials, debt management, and cash flow performance.
Core Metrics Are Climbing
Revenue has increased consistently year-over-year. EBIT has followed suit. But what really stands out? EBIT margin has more than doubled between 2020 and 2024—largely thanks to rising menu prices. That growth has translated into greater operational profitability.
Debt? It’s Under Control
While debt has increased, Chipotle’s EBIT has grown even faster. That means the debt-to-EBITDA ratio has dropped from 4.2x in 2020 to just 1.6x in 2024. In other words, the company’s capacity to service debt is improving rapidly—even if total obligations are rising.
Valuation Compression
Enterprise value (EV) has grown strongly, rebounding after a dip in 2022. But the EV-to-EBITDA ratio—a key valuation metric—has halved from a lofty 72x to around 35x. That’s still expensive, but at least we’re trending in a more investor-friendly direction.
Free Cash Flow: The Investor’s Treasure Map
Chipotle’s free cash flow to equity (FCFE) has expanded dramatically. From a 5% margin in 2020 to 13% in 2024. That’s fueled by 17% average annual revenue growth and a whopping 51% compound annual growth in FCFE.
Operating cash flow is rising at an impressive 33% annually, with CapEx growing more moderately—perfectly reasonable as the company continues to scale.
Free cash flow per share is also on the rise, though free cash flow yield has remained steady at around 1.9%. So yes, returns are better, but the higher share price keeps yield in check.
Bonus for investors: the number of shares outstanding is declining every year. That means less dilution and a larger slice of the Chipotle pie.
Price Targets: Let's Talk Forecasts
| Method |
Assumptions |
2034 Price Target |
| Enterprise Value Model |
4–12% revenue growth (avg. 9%), 20% EBIT margin, 35× market multiple |
$142–143 |
| Free Cash Flow to Equity Model |
Similar growth rates, 1.5% yield |
$172 |
| Blended Target (Equal Weighting) |
Based on averaging the two models above |
$157 |
Our model applies a revenue growth rate starting at 4% in 2025—aligned with Chipotle’s guidance—and ramps it to 12% before tapering to 7% by 2034. On average, that’s a 9% growth rate across the forecast period.
Using a 20% EBIT margin and a 35x market multiple (conservatively lower than today’s), we land at an enterprise value price target of $142–143 by 2034.
Then we run a free cash flow to equity model using similar growth rates and a 1.5% yield, arriving at a price target of $172 by 2034.
Weighing both equally gives us a blended price target of $157.
The model's assumptions and projections are visualized using custom charts to illustrate revenue growth curves, margin expansion, and cash flow acceleration—all crucial for understanding how the numbers stack up over the next decade.
Coming up next: we’ll walk through discounted cash flow (DCF) analysis, the expected internal rate of return (IRR), and that final star rating.
Fair Value and Valuation Recap: Is Chipotle Still Undervalued?
Now comes the part most investors love—valuation.
Using the forecasted free cash flow model and discounting to present value, the fair share price for Chipotle is estimated at $52.50 today. That’s just about a 9% discount from the current market price. Not exactly fire-sale territory, but enough to keep things interesting.
Put simply, the stock isn’t drastically undervalued. A 9% margin of safety isn’t huge—it’s right on the edge of the “maybe” zone for value-driven investors.
Crunching the Numbers: IRR and What That Means for Returns
Here’s where things perk up. The estimated internal rate of return (IRR) lands at 17%, well above the S&P 500’s typical 8–10% range.
That figure includes both:
- The free cash flow per share generated over the next decade
- The projected increase in share price by 2034
A visual breakdown (included in the original presentation) illustrates how today’s purchase is an upfront hit (the red zone), offset by the growing free cash flow distributions across the forecast period, and culminating in a gain on the exit price.
Interestingly, if the stock were to drop 30% from today’s price, the annual return could jump to 22%. So while it’s already attractive, a short-term dip could present a strong buying opportunity for long-term investors.
Chipotle's Final Star Rating: The Scorecard
Here’s how the metrics stack up in our final star rating system:
- Revenue Growth: 4/5 — Strong, but not flawless
- EBIT Growth: 5/5 — Margin expansion has been stellar
- Free Cash Flow Growth: 5/5 — Consistently climbing
- Debt Position: 5/5 — Low leverage, high flexibility
- Stock Performance: 3/5 — Returns are strong, but volatility knocks points off
- Valuation vs. Return: 4/5 for expected IRR, 3/5 for current valuation
- Competitive Positioning: 4/5 — Expansion strategy is solid
- Brand Strength: 5/5 — A consumer and employee favorite
- Regulatory and Macro Risk: 3/5 — Exposure to tariffs and supply chain risk remains
Overall Rating: 4/5 Stars
Chipotle balances strong financials with brand equity and international expansion potential. But as a restaurant business, it’s still capital-intensive and vulnerable to global trade disruptions.
Read More: Some more restaurant ideas
| Symbol |
Company Name |
Why It Might Be Better Than CMG |
| MCD |
McDonald's Corporation |
Global presence, diversified menu, and dividend-paying—offering more stability and income. |
| SBUX |
Starbucks Corporation |
Strong digital ecosystem and global expansion drive recurring engagement and growth. |
| YUM |
Yum! Brands, Inc. |
Multiple franchises across cuisines and markets spread risk and maximize growth opportunities. |
| DPZ |
Domino’s Pizza, Inc. |
Tech-savvy delivery operations and global franchise model offer scalability and agility. |
| TXRH |
Texas Roadhouse, Inc. |
Strong same-store sales and value-oriented strategy appeal in economic slowdowns. |
Final Thoughts
Chipotle stands out as one of the most compelling restaurant stocks available today. With accelerating margins, steady revenue growth, and an iconic brand, the long-term outlook is promising.
Yes, it’s a restaurant—and yes, that comes with its own set of macroeconomic risks, including tariffs on imported ingredients. But if you believe those headwinds are temporary, the company’s operational efficiency and growth strategy could deliver handsomely.
Thanks for reading. For a deeper dive—including the five-year financials, full DCF assumptions, and summary forecast—check out the free one-pager linked below. And don’t forget to share how you’d tweak the assumptions, especially around growth rates. Always open to learning from other investors.
https://youtu.be/z6pCXpllAGA?si=fBTj-q_AIZ1kalZD


A $1,000 investment in Chipotle back in 2006? That'd be worth over $50,000 today. But here's where it gets even more interesting—Chipotle still plans to double its store count. So, are we late to the party, or is there still a seat at the table?
In this breakdown, we’ll walk through five years of Chipotle’s financials and a 10-year forecast model to see what kind of return investors might expect going forward. We’re working toward two key answers: a fair value price estimate and an annual return projection. And yes, it all wraps up with a star rating.
Let’s start from the beginning.
What Exactly Is Chipotle?
Chipotle is one of the U.S.'s premier fast-casual restaurant chains, renowned for fully customizable burritos, bowls, and tacos. Founded in 1993, the company has grown to operate over 3,000 locations—and that number’s expected to hit 7,000 in the next decade.
Here’s a major detail: every restaurant is company-owned. No franchises.
Revenue primarily comes from in-store and digital sales, the latter now driving more than 35% of total revenue. That digital push doesn’t just add convenience—it increases margins too. With its efficiency-first model, high-margin menu, and low food waste, Chipotle has become one of the fastest-growing and most profitable names in the S&P 500.
Financials Recap: How Has Chipotle Performed?
Before jumping into our forecast model, let’s recap historical performance using three key lenses: core financials, debt management, and cash flow performance.
Core Metrics Are Climbing
Revenue has increased consistently year-over-year. EBIT has followed suit. But what really stands out? EBIT margin has more than doubled between 2020 and 2024—largely thanks to rising menu prices. That growth has translated into greater operational profitability.
Debt? It’s Under Control
While debt has increased, Chipotle’s EBIT has grown even faster. That means the debt-to-EBITDA ratio has dropped from 4.2x in 2020 to just 1.6x in 2024. In other words, the company’s capacity to service debt is improving rapidly—even if total obligations are rising.
Valuation Compression
Enterprise value (EV) has grown strongly, rebounding after a dip in 2022. But the EV-to-EBITDA ratio—a key valuation metric—has halved from a lofty 72x to around 35x. That’s still expensive, but at least we’re trending in a more investor-friendly direction.
Free Cash Flow: The Investor’s Treasure Map
Chipotle’s free cash flow to equity (FCFE) has expanded dramatically. From a 5% margin in 2020 to 13% in 2024. That’s fueled by 17% average annual revenue growth and a whopping 51% compound annual growth in FCFE.
Operating cash flow is rising at an impressive 33% annually, with CapEx growing more moderately—perfectly reasonable as the company continues to scale.
Free cash flow per share is also on the rise, though free cash flow yield has remained steady at around 1.9%. So yes, returns are better, but the higher share price keeps yield in check.
Bonus for investors: the number of shares outstanding is declining every year. That means less dilution and a larger slice of the Chipotle pie.
Price Targets: Let's Talk Forecasts
Our model applies a revenue growth rate starting at 4% in 2025—aligned with Chipotle’s guidance—and ramps it to 12% before tapering to 7% by 2034. On average, that’s a 9% growth rate across the forecast period.
Using a 20% EBIT margin and a 35x market multiple (conservatively lower than today’s), we land at an enterprise value price target of $142–143 by 2034.
Then we run a free cash flow to equity model using similar growth rates and a 1.5% yield, arriving at a price target of $172 by 2034.
Weighing both equally gives us a blended price target of $157.
The model's assumptions and projections are visualized using custom charts to illustrate revenue growth curves, margin expansion, and cash flow acceleration—all crucial for understanding how the numbers stack up over the next decade.
Coming up next: we’ll walk through discounted cash flow (DCF) analysis, the expected internal rate of return (IRR), and that final star rating.
Fair Value and Valuation Recap: Is Chipotle Still Undervalued?
Now comes the part most investors love—valuation.
Using the forecasted free cash flow model and discounting to present value, the fair share price for Chipotle is estimated at $52.50 today. That’s just about a 9% discount from the current market price. Not exactly fire-sale territory, but enough to keep things interesting.
Put simply, the stock isn’t drastically undervalued. A 9% margin of safety isn’t huge—it’s right on the edge of the “maybe” zone for value-driven investors.
Crunching the Numbers: IRR and What That Means for Returns
Here’s where things perk up. The estimated internal rate of return (IRR) lands at 17%, well above the S&P 500’s typical 8–10% range.
That figure includes both:
A visual breakdown (included in the original presentation) illustrates how today’s purchase is an upfront hit (the red zone), offset by the growing free cash flow distributions across the forecast period, and culminating in a gain on the exit price.
Interestingly, if the stock were to drop 30% from today’s price, the annual return could jump to 22%. So while it’s already attractive, a short-term dip could present a strong buying opportunity for long-term investors.
Chipotle's Final Star Rating: The Scorecard
Here’s how the metrics stack up in our final star rating system:
Overall Rating: 4/5 Stars
Chipotle balances strong financials with brand equity and international expansion potential. But as a restaurant business, it’s still capital-intensive and vulnerable to global trade disruptions.
Final Thoughts
Chipotle stands out as one of the most compelling restaurant stocks available today. With accelerating margins, steady revenue growth, and an iconic brand, the long-term outlook is promising.
Yes, it’s a restaurant—and yes, that comes with its own set of macroeconomic risks, including tariffs on imported ingredients. But if you believe those headwinds are temporary, the company’s operational efficiency and growth strategy could deliver handsomely.
Thanks for reading. For a deeper dive—including the five-year financials, full DCF assumptions, and summary forecast—check out the free one-pager linked below. And don’t forget to share how you’d tweak the assumptions, especially around growth rates. Always open to learning from other investors.
https://youtu.be/z6pCXpllAGA?si=fBTj-q_AIZ1kalZD