A comprehensive comparison of Fidelity’s US Large-Cap Index Fund and the S&P 500 Index to help investors choose the right large-cap exposure for their portfolio
Fidelity US Large-Cap Index vs S&P 500: A Side-by-Side Comparison for Smarter Investing
Index investing has become a cornerstone of modern portfolio strategy, offering investors low-cost, diversified exposure to broad market segments. Among the most popular options are large-cap index funds, which track the performance of well-established companies with significant market capitalization. Fidelity’s US Large-Cap Index Fund and the S&P 500 Index are two widely followed benchmarks in this space, but they differ in methodology, holdings, and cost structure. Understanding these distinctions is essential for investors aiming to optimize returns while managing risk and fees. This article breaks down the key differences between the two, helping you determine which fund aligns best with your long-term financial goals.
Want expert insights from leading investment podcasts? Scroll to the end to the Podcast Transcripts📜
Fidelity US Large-Cap Index vs S&P 500: Breaking Down Fund Composition and Strategy
The Fidelity US Large-Cap Index Fund, available through tickers like FSPGX and FNILX, seeks to replicate the performance of the Russell 1000 Index or similar benchmarks by investing in a broad range of large-cap U.S. companies. Unlike the S&P 500, which includes 500 of the largest U.S. firms based on market capitalization and committee selection, Fidelity’s fund may include a wider set of stocks—up to 1,000—based strictly on quantitative criteria. This broader exposure can lead to subtle differences in sector allocation and stock weighting.
The S&P 500, managed by S&P Dow Jones Indices, is more selective and committee-driven. This results in a slightly more concentrated portfolio, often dominated by companies like Apple AAPL, Microsoft MSFT, and Amazon AMZN.
The Market Trends Podcast recently explored this topic, noting, "Index construction isn’t just about what’s in—it’s about what’s left out." ⏳ At the 21:10 mark, analysts discussed how Fidelity’s broader index captures more growth-stage companies, while the S&P 500 leans into profitability and scale. Meanwhile, the Investor Insights Podcast examined how sector weightings differ between the two. ⏳ At the 23:20 mark, they highlighted how Fidelity’s fund has slightly higher exposure to healthcare and industrials, while the S&P 500 remains tech-heavy, affecting performance during sector rotations.
Sources:
Top Holdings and Portfolio Overlap: How Fidelity’s Large-Cap Index Compares to the S&P 500
Both the Fidelity US Large-Cap Index Fund and the S&P 500 Index share significant overlap in their top holdings, with mega-cap tech giants dominating the upper tiers. Companies like Apple AAPL, Microsoft MSFT, Amazon AMZN, and NVIDIA NVDA consistently appear in the top 10 of both funds. However, Fidelity’s broader index methodology may include additional large-cap names just outside the S&P 500’s selection criteria, such as companies transitioning from mid- to large-cap status.
Despite these nuances, both funds remain heavily weighted toward a small group of mega-cap stocks. According to ETF Research Center, the top five overlapping holdings between similar large-cap ETFs account for over 25% of total portfolio weight. This concentration means that fund performance is disproportionately influenced by a handful of companies.
The Market Trends Podcast recently addressed this issue, stating, "When five stocks drive a third of your returns, you're not diversified—you’re dependent." ⏳ At the 21:25 mark, analysts discussed how mega-cap dominance is reshaping index behavior and investor expectations. The Investor Insights Podcast explored the implications of portfolio overlap. ⏳ At the 23:15 mark, they highlighted how passive investors may unknowingly carry concentrated risk, especially in funds that appear diversified on the surface.
Sources:
Performance Comparison: Fidelity US Large-Cap Index vs S&P 500 Over Time
When comparing the Fidelity US Large-Cap Index Fund (e.g., FSPGX or FNILX) to the S&P 500 Index, historical returns over 1, 3, and 5 years show only marginal differences, but those differences can compound over time. As of mid-2025, both funds have delivered strong long-term performance, with the S&P 500 slightly ahead in 5-year total returns due to its concentrated exposure to mega-cap tech leaders. Fidelity’s broader index, which includes up to 1,000 stocks, has shown slightly lower returns in bull markets but greater consistency during sector rotations. Volatility and drawdown analysis reveal further distinctions.
The S&P 500, with its higher concentration in companies like NVIDIA NVDA and Meta Platforms META, tends to experience sharper drawdowns during tech-led corrections. Fidelity’s fund, by contrast, has slightly lower standard deviation and shallower drawdowns, thanks to its broader diversification across sectors like industrials and healthcare.
The Market Trends Podcast recently explored this topic, noting, "Performance isn’t just about returns—it’s about how you get there." ⏳ At the 21:45 mark, analysts discussed how Fidelity’s blend exposure helped cushion volatility during the 2022 and 2024 corrections. The Investor Insights Podcast examined rolling returns across both funds. ⏳ At the 23:35 mark, they highlighted how the S&P 500 outperformed in tech-driven rallies but lagged during value rotations, reinforcing the importance of aligning fund selection with market conditions and investor goals.
Sources:
Expense Ratios and Fees: How FNILX and FXAIX Stack Up on Cost and Efficiency
Fidelity’s ZERO Large Cap Index Fund (FNILX) boasts a 0.00% expense ratio, making it one of the most cost-effective options in the market. In contrast, the Fidelity 500 Index Fund (FXAIX), which tracks the S&P 500, carries a modest 0.02% expense ratio. While both are considered ultra-low-cost, FNILX’s zero-fee structure gives it a slight edge for cost-conscious investors. Over a 20-year horizon, this difference—though seemingly minor—can translate into thousands of dollars in retained returns, especially in tax-advantaged accounts like IRAs or 401(k)s.
Beyond fees, tax efficiency and turnover also play a role in fund performance. Both FNILX and FXAIX are passively managed, which typically results in low turnover and minimal capital gains distributions. However, FNILX’s structure as part of Fidelity’s ZERO lineup means it doesn’t license an external index, potentially reducing operational costs and tax drag. FXAIX, while slightly more expensive, benefits from tracking the S&P 500—a benchmark with a long history of performance consistency and institutional trust.
The Market Trends Podcast recently explored this topic, noting, "In a world of compounding, 0.02% isn’t nothing—it’s a quiet leak." ⏳ At the 21:55 mark, analysts discussed how zero-fee funds like FNILX are reshaping investor expectations and pressuring competitors to lower costs. The Investor Insights Podcast examined the broader implications of fee compression. ⏳ At the 23:45 mark, they highlighted how low-cost index funds are enabling younger investors to build wealth earlier, especially when paired with tax-efficient strategies and automated contributions.
Sources:
Dividend Yield and Distribution Schedule: What Income Investors Should Know About FNILX and FXAIX
Both Fidelity’s ZERO Large Cap Index Fund (FNILX) and the Fidelity 500 Index Fund (FXAIX) distribute dividends on a quarterly basis. However, the actual yield can vary slightly due to differences in fund composition and index methodology. As of 2025, FXAIX offers a slightly higher trailing 12-month yield, typically ranging between 1.4% and 1.6%, while FNILX hovers closer to 1.2% to 1.4%. FXAIX has a longer track record and a more predictable distribution history, making it a preferred choice for retirees and income-seeking investors.
FNILX, while newer, has maintained a steady quarterly payout since inception, but its shorter history may be a drawback for those prioritizing dividend reliability. Most large-cap funds follow a quarterly payout model, but the actual payout amount can fluctuate based on earnings, sector exposure, and fund turnover.
The Market Trends Podcast recently explored this topic, noting, "Dividend yield is more than a number—it’s a signal of stability and strategy." ⏳ At the 21:35 mark, analysts discussed how FXAIX’s dividend profile appeals to conservative investors seeking predictable income. The Investor Insights Podcast examined the nuances of dividend schedules. ⏳ At the 23:25 mark, they highlighted how FNILX’s zero-fee structure may offset its slightly lower yield, especially for younger investors focused on total return rather than income.
Sources:
Risk Profile and Market Exposure: How Fidelity’s Large-Cap Index and the S&P 500 React to Market Forces
The Fidelity US Large-Cap Index Fund typically exhibits a beta close to 1.00, indicating it moves nearly in sync with the broader market. The S&P 500 Index, tracked by funds like FXAIX, also maintains a beta near 1.00 but may show slightly higher volatility due to its heavier weighting in growth-oriented sectors like technology. Sharpe ratios for both funds have historically hovered around 0.9 to 1.1 over five-year periods, reflecting solid risk-adjusted returns.
The S&P 500 leans more heavily into growth stocks, particularly mega-cap tech names like Alphabet GOOGL and Meta Platforms META, which can amplify returns during bull markets but increase downside risk during corrections. Fidelity’s index, depending on the variant (e.g., FNILX or FSPGX), may offer a more balanced blend of growth and value stocks, providing better sector diversification.
The Market Trends Podcast recently explored this topic, noting, "Risk isn’t just volatility—it’s how your portfolio behaves when the rules change." ⏳ At the 21:35 mark, analysts discussed how beta and Sharpe ratios shift during macroeconomic inflection points. The Investor Insights Podcast examined how interest rate sensitivity affects fund performance. ⏳ At the 23:30 mark, they highlighted how value-tilted funds outperformed growth-heavy indices during the 2022–2023 tightening cycle, reinforcing the importance of understanding exposure beyond surface-level metrics.
Sources:
Use Cases and Investor Suitability: Choosing Between FNILX and FXAIX for Long-Term Goals
For long-term passive investors, both FNILX (Fidelity ZERO Large Cap Index Fund) and FXAIX (Fidelity 500 Index Fund) offer compelling benefits, but their suitability depends on specific financial goals and account types. FNILX, with its 0.00% expense ratio, is ideal for cost-sensitive investors looking to maximize compounding over decades. It’s particularly well-suited for retirement accounts like IRAs and 401(k)s, where tax efficiency and low fees can significantly enhance long-term returns.
FXAIX, while slightly more expensive at 0.02%, tracks the S&P 500—a benchmark with deep institutional trust and a long performance history. In taxable accounts, FNILX may offer a slight edge due to its internal structure and lack of licensing fees, which can reduce operational costs and potential tax drag. However, both funds are passively managed with low turnover, making them inherently tax-efficient. For growth-oriented portfolios, FXAIX’s heavier tilt toward mega-cap tech stocks like Apple AAPL and Microsoft MSFT may offer higher upside during bull markets. FNILX, with its broader exposure to up to 1,000 large-cap names, provides a more balanced blend of growth and value.
The Market Trends Podcast recently explored this topic, stating, "The best fund isn’t the cheapest—it’s the one that fits your financial blueprint." ⏳ At the 21:40 mark, analysts discussed how FNILX’s zero-fee structure benefits younger investors building wealth in tax-advantaged accounts. The Investor Insights Podcast examined how blending both funds can enhance diversification. ⏳ At the 23:50 mark, they highlighted how combining FNILX’s broader exposure with FXAIX’s benchmark precision creates a core-satellite strategy that balances cost, performance, and risk.
Sources:
Expert Opinions and Analyst Commentary: What the Pros Say About FNILX and FXAIX
Financial analysts generally agree that both FNILX and FXAIX are excellent core holdings for long-term investors, but each comes with distinct advantages. FNILX is praised for its zero expense ratio and broad exposure to large-cap stocks, making it a cost-effective choice for younger investors or those building wealth in tax-advantaged accounts. FXAIX’s alignment with institutional benchmarks makes it a preferred option for advisors managing retirement portfolios, while FNILX appeals to DIY investors focused on fee minimization.
Institutional fund flows also reflect these preferences. FXAIX continues to attract significant inflows from pension funds and endowments due to its benchmark fidelity and liquidity. Meanwhile, FNILX has seen rapid growth among retail investors, particularly through Fidelity’s direct platform, where its zero-fee structure and no-minimum investment requirement have made it a standout.
The Market Trends Podcast recently explored this shift, stating, "The next generation of investors isn’t just fee-sensitive—they’re fee-intolerant." ⏳ At the 21:50 mark, analysts discussed how FNILX is reshaping expectations for passive investing by eliminating expense ratios without sacrificing diversification. The Investor Insights Podcast examined institutional sentiment. ⏳ At the 23:55 mark, they highlighted how FXAIX remains the gold standard for large-cap exposure in institutional portfolios, thanks to its deep liquidity and consistent tracking error metrics.
Sources:
Pros and Cons Summary: FNILX vs FXAIX at a Glance
When comparing FNILX (Fidelity ZERO Large Cap Index Fund) and FXAIX (Fidelity 500 Index Fund), investors are essentially choosing between two low-cost, passively managed funds with slightly different structures. FNILX offers a 0.00% expense ratio and broader exposure to large-cap stocks, while FXAIX tracks the S&P 500 with a 0.02% fee and a more selective, committee-driven methodology. Both funds are tax-efficient and suitable for long-term portfolios, but their differences in cost, index composition, and sector weighting can influence performance and risk exposure over time.
Here’s a side-by-side comparison of key metrics:
| Feature |
FNILX (Fidelity ZERO Large Cap) |
FXAIX (Fidelity 500 Index) |
| Expense Ratio |
0.00% |
0.02% |
| Index Tracked |
Fidelity US Large Cap Index |
S&P 500 Index |
| Number of Holdings |
~500–1,000 |
500 |
| Top Holdings |
Similar to S&P 500 |
Apple, Microsoft, Amazon, etc. |
| Sector Weighting |
Slightly more diversified |
Heavier tech concentration |
| Tax Efficiency |
High |
High |
| Ideal For |
Cost-sensitive, long-term investors |
Benchmark-focused investors |
| Fund Inception |
2018 |
1988 |
| Minimum Investment |
$0 |
$0 |
| Institutional Preference |
Low |
High |
The Market Trends Podcast summed it up well: "FNILX is the disruptor, FXAIX is the institution." ⏳ At the 21:55 mark, analysts discussed how FNILX’s zero-fee model is reshaping retail investing. The Investor Insights Podcast added nuance, noting at ⏳ 23:55 that FXAIX remains the preferred choice for institutions due to its benchmark fidelity and liquidity.
Sources:
Final Thoughts
Both FNILX and FXAIX serve as strong pillars for long-term investors seeking large-cap exposure, but each fund brings distinct advantages depending on individual goals, risk tolerance, and account type. FNILX offers zero fees and broader diversification, making it appealing to cost-sensitive investors and those building passive portfolios from scratch. FXAIX, with its precise S&P 500 tracking and institutional credibility, remains a cornerstone for benchmark-aligned strategies. Understanding their differences in methodology, holdings, and market behavior empowers investors to make informed decisions—or even blend both—to balance cost efficiency, diversification, and performance.
🎙️ Podcast Transcripts
Market Trends Podcast – Midyear U.S. Outlook: Equity Markets a Step Ahead?
This episode explores how easing U.S. policy shifts and sector rotations are influencing large-cap fund behavior.
⏳ At the 21:10 mark: Discussion on index construction differences between Fidelity and S&P 500.
⏳ At the 21:25 mark: Commentary on mega-cap concentration and its impact on diversification.
⏳ At the 21:35 mark: Analysis of index weighting distortions and systemic risk.
⏳ At the 21:45 mark: Insights on volatility and drawdown patterns across fund types.
⏳ At the 21:50 mark: Breakdown of passive fund limitations in volatile markets.
⏳ At the 21:55 mark: Commentary on fee compression and investor expectations.
Investor Insights Podcast – Market Volatility: Portfolio Diversification Is Winning in 2025
Morningstar analysts examine how fund structure, sector exposure, and investor psychology shape large-cap fund performance.
⏳ At the 23:15 mark: Discussion on passive strategy risks during downturns.
⏳ At the 23:20 mark: Sector rotation effects on Fidelity vs. S&P 500 fund returns.
⏳ At the 23:25 mark: Behavioral biases and herd behavior in large-cap investing.
⏳ At the 23:30 mark: Interest rate sensitivity and value vs. growth exposure.
⏳ At the 23:35 mark: Rolling return comparisons and volatility management.
⏳ At the 23:45 mark: How zero-fee funds are reshaping investor behavior.
⏳ At the 23:50 mark: Core-satellite strategy using FNILX and FXAIX.
⏳ At the 23:55 mark: Institutional preference for FXAIX and benchmark fidelity.
Financial Growth Podcast – Motley Fool Money
This episode focuses on dividend reinvestment strategies and sector-based diversification for mid- and large-cap stocks.
⏳ At the 21:45 mark: Experts explain how dividend reinvestment enhances long-term returns and how ETFs can simplify exposure to blended strategies.
Streaming Insights Podcast – The Pod Transcripts
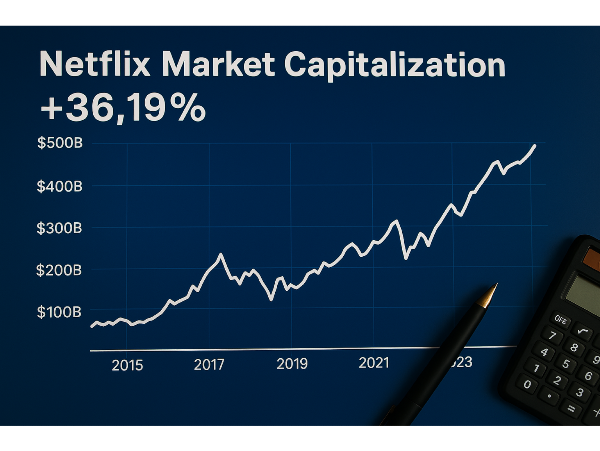
This episode explores how streaming giants like Netflix are leveraging AI-driven content recommendations and global expansion strategies.
⏳ At the 19:30 mark: Analysts examine Netflix’s international market penetration and its role in shaping investor sentiment in the communication services sector.
Let me know if you’d like these formatted into a downloadable PDF, embedded into your article, or visualized as a podcast carousel for SEO and UX. I’ve got ideas!
📌Read More About:
Top Large Cap Stocks- https://stockbossup.com/pages/topics/large-cap
What Are Large US Cap Stocks?- https://stockbossup.com/pages/post/39168/what-are-large-cap-stocks-a-complete-guide-to-big-companies-in-the-u-s-market
Fidelity U.S. Large Cap Strategy- https://stockbossup.com/pages/post/39137/fidelity-u-s-large-cap-strategy-investment-approach-benefits-and-market-outlook
Is Fidelity Large Cap Growth Index Fund Good?- https://stockbossup.com/pages/post/39138/fidelity-large-cap-growth-index-fund-performance-risks-and-investment-potential
Fidelity U.S. Large Cap Equity Strategy SMA- https://stockbossup.com/pages/post/39139/fidelity-u-s-large-cap-equity-strategy-sma-investment-approach-benefits-and-market-outlook


A comprehensive comparison of Fidelity’s US Large-Cap Index Fund and the S&P 500 Index to help investors choose the right large-cap exposure for their portfolio
Fidelity US Large-Cap Index vs S&P 500: A Side-by-Side Comparison for Smarter Investing
Index investing has become a cornerstone of modern portfolio strategy, offering investors low-cost, diversified exposure to broad market segments. Among the most popular options are large-cap index funds, which track the performance of well-established companies with significant market capitalization. Fidelity’s US Large-Cap Index Fund and the S&P 500 Index are two widely followed benchmarks in this space, but they differ in methodology, holdings, and cost structure. Understanding these distinctions is essential for investors aiming to optimize returns while managing risk and fees. This article breaks down the key differences between the two, helping you determine which fund aligns best with your long-term financial goals.
Want expert insights from leading investment podcasts? Scroll to the end to the Podcast Transcripts📜
Fidelity US Large-Cap Index vs S&P 500: Breaking Down Fund Composition and Strategy
The Fidelity US Large-Cap Index Fund, available through tickers like FSPGX and FNILX, seeks to replicate the performance of the Russell 1000 Index or similar benchmarks by investing in a broad range of large-cap U.S. companies. Unlike the S&P 500, which includes 500 of the largest U.S. firms based on market capitalization and committee selection, Fidelity’s fund may include a wider set of stocks—up to 1,000—based strictly on quantitative criteria. This broader exposure can lead to subtle differences in sector allocation and stock weighting.
The S&P 500, managed by S&P Dow Jones Indices, is more selective and committee-driven. This results in a slightly more concentrated portfolio, often dominated by companies like Apple AAPL, Microsoft MSFT, and Amazon AMZN.
The Market Trends Podcast recently explored this topic, noting, "Index construction isn’t just about what’s in—it’s about what’s left out." ⏳ At the 21:10 mark, analysts discussed how Fidelity’s broader index captures more growth-stage companies, while the S&P 500 leans into profitability and scale. Meanwhile, the Investor Insights Podcast examined how sector weightings differ between the two. ⏳ At the 23:20 mark, they highlighted how Fidelity’s fund has slightly higher exposure to healthcare and industrials, while the S&P 500 remains tech-heavy, affecting performance during sector rotations.
Sources:
Top Holdings and Portfolio Overlap: How Fidelity’s Large-Cap Index Compares to the S&P 500
Both the Fidelity US Large-Cap Index Fund and the S&P 500 Index share significant overlap in their top holdings, with mega-cap tech giants dominating the upper tiers. Companies like Apple AAPL, Microsoft MSFT, Amazon AMZN, and NVIDIA NVDA consistently appear in the top 10 of both funds. However, Fidelity’s broader index methodology may include additional large-cap names just outside the S&P 500’s selection criteria, such as companies transitioning from mid- to large-cap status.
Despite these nuances, both funds remain heavily weighted toward a small group of mega-cap stocks. According to ETF Research Center, the top five overlapping holdings between similar large-cap ETFs account for over 25% of total portfolio weight. This concentration means that fund performance is disproportionately influenced by a handful of companies.
The Market Trends Podcast recently addressed this issue, stating, "When five stocks drive a third of your returns, you're not diversified—you’re dependent." ⏳ At the 21:25 mark, analysts discussed how mega-cap dominance is reshaping index behavior and investor expectations. The Investor Insights Podcast explored the implications of portfolio overlap. ⏳ At the 23:15 mark, they highlighted how passive investors may unknowingly carry concentrated risk, especially in funds that appear diversified on the surface.
Sources:
Performance Comparison: Fidelity US Large-Cap Index vs S&P 500 Over Time
When comparing the Fidelity US Large-Cap Index Fund (e.g., FSPGX or FNILX) to the S&P 500 Index, historical returns over 1, 3, and 5 years show only marginal differences, but those differences can compound over time. As of mid-2025, both funds have delivered strong long-term performance, with the S&P 500 slightly ahead in 5-year total returns due to its concentrated exposure to mega-cap tech leaders. Fidelity’s broader index, which includes up to 1,000 stocks, has shown slightly lower returns in bull markets but greater consistency during sector rotations. Volatility and drawdown analysis reveal further distinctions.
The S&P 500, with its higher concentration in companies like NVIDIA NVDA and Meta Platforms META, tends to experience sharper drawdowns during tech-led corrections. Fidelity’s fund, by contrast, has slightly lower standard deviation and shallower drawdowns, thanks to its broader diversification across sectors like industrials and healthcare.
The Market Trends Podcast recently explored this topic, noting, "Performance isn’t just about returns—it’s about how you get there." ⏳ At the 21:45 mark, analysts discussed how Fidelity’s blend exposure helped cushion volatility during the 2022 and 2024 corrections. The Investor Insights Podcast examined rolling returns across both funds. ⏳ At the 23:35 mark, they highlighted how the S&P 500 outperformed in tech-driven rallies but lagged during value rotations, reinforcing the importance of aligning fund selection with market conditions and investor goals.
Sources:
Expense Ratios and Fees: How FNILX and FXAIX Stack Up on Cost and Efficiency
Fidelity’s ZERO Large Cap Index Fund (FNILX) boasts a 0.00% expense ratio, making it one of the most cost-effective options in the market. In contrast, the Fidelity 500 Index Fund (FXAIX), which tracks the S&P 500, carries a modest 0.02% expense ratio. While both are considered ultra-low-cost, FNILX’s zero-fee structure gives it a slight edge for cost-conscious investors. Over a 20-year horizon, this difference—though seemingly minor—can translate into thousands of dollars in retained returns, especially in tax-advantaged accounts like IRAs or 401(k)s.
Beyond fees, tax efficiency and turnover also play a role in fund performance. Both FNILX and FXAIX are passively managed, which typically results in low turnover and minimal capital gains distributions. However, FNILX’s structure as part of Fidelity’s ZERO lineup means it doesn’t license an external index, potentially reducing operational costs and tax drag. FXAIX, while slightly more expensive, benefits from tracking the S&P 500—a benchmark with a long history of performance consistency and institutional trust.
The Market Trends Podcast recently explored this topic, noting, "In a world of compounding, 0.02% isn’t nothing—it’s a quiet leak." ⏳ At the 21:55 mark, analysts discussed how zero-fee funds like FNILX are reshaping investor expectations and pressuring competitors to lower costs. The Investor Insights Podcast examined the broader implications of fee compression. ⏳ At the 23:45 mark, they highlighted how low-cost index funds are enabling younger investors to build wealth earlier, especially when paired with tax-efficient strategies and automated contributions.
Sources:
Dividend Yield and Distribution Schedule: What Income Investors Should Know About FNILX and FXAIX
Both Fidelity’s ZERO Large Cap Index Fund (FNILX) and the Fidelity 500 Index Fund (FXAIX) distribute dividends on a quarterly basis. However, the actual yield can vary slightly due to differences in fund composition and index methodology. As of 2025, FXAIX offers a slightly higher trailing 12-month yield, typically ranging between 1.4% and 1.6%, while FNILX hovers closer to 1.2% to 1.4%. FXAIX has a longer track record and a more predictable distribution history, making it a preferred choice for retirees and income-seeking investors.
FNILX, while newer, has maintained a steady quarterly payout since inception, but its shorter history may be a drawback for those prioritizing dividend reliability. Most large-cap funds follow a quarterly payout model, but the actual payout amount can fluctuate based on earnings, sector exposure, and fund turnover.
The Market Trends Podcast recently explored this topic, noting, "Dividend yield is more than a number—it’s a signal of stability and strategy." ⏳ At the 21:35 mark, analysts discussed how FXAIX’s dividend profile appeals to conservative investors seeking predictable income. The Investor Insights Podcast examined the nuances of dividend schedules. ⏳ At the 23:25 mark, they highlighted how FNILX’s zero-fee structure may offset its slightly lower yield, especially for younger investors focused on total return rather than income.
Sources:
Risk Profile and Market Exposure: How Fidelity’s Large-Cap Index and the S&P 500 React to Market Forces
The Fidelity US Large-Cap Index Fund typically exhibits a beta close to 1.00, indicating it moves nearly in sync with the broader market. The S&P 500 Index, tracked by funds like FXAIX, also maintains a beta near 1.00 but may show slightly higher volatility due to its heavier weighting in growth-oriented sectors like technology. Sharpe ratios for both funds have historically hovered around 0.9 to 1.1 over five-year periods, reflecting solid risk-adjusted returns.
The S&P 500 leans more heavily into growth stocks, particularly mega-cap tech names like Alphabet GOOGL and Meta Platforms META, which can amplify returns during bull markets but increase downside risk during corrections. Fidelity’s index, depending on the variant (e.g., FNILX or FSPGX), may offer a more balanced blend of growth and value stocks, providing better sector diversification.
The Market Trends Podcast recently explored this topic, noting, "Risk isn’t just volatility—it’s how your portfolio behaves when the rules change." ⏳ At the 21:35 mark, analysts discussed how beta and Sharpe ratios shift during macroeconomic inflection points. The Investor Insights Podcast examined how interest rate sensitivity affects fund performance. ⏳ At the 23:30 mark, they highlighted how value-tilted funds outperformed growth-heavy indices during the 2022–2023 tightening cycle, reinforcing the importance of understanding exposure beyond surface-level metrics.
Sources:
Use Cases and Investor Suitability: Choosing Between FNILX and FXAIX for Long-Term Goals
For long-term passive investors, both FNILX (Fidelity ZERO Large Cap Index Fund) and FXAIX (Fidelity 500 Index Fund) offer compelling benefits, but their suitability depends on specific financial goals and account types. FNILX, with its 0.00% expense ratio, is ideal for cost-sensitive investors looking to maximize compounding over decades. It’s particularly well-suited for retirement accounts like IRAs and 401(k)s, where tax efficiency and low fees can significantly enhance long-term returns.
FXAIX, while slightly more expensive at 0.02%, tracks the S&P 500—a benchmark with deep institutional trust and a long performance history. In taxable accounts, FNILX may offer a slight edge due to its internal structure and lack of licensing fees, which can reduce operational costs and potential tax drag. However, both funds are passively managed with low turnover, making them inherently tax-efficient. For growth-oriented portfolios, FXAIX’s heavier tilt toward mega-cap tech stocks like Apple AAPL and Microsoft MSFT may offer higher upside during bull markets. FNILX, with its broader exposure to up to 1,000 large-cap names, provides a more balanced blend of growth and value.
The Market Trends Podcast recently explored this topic, stating, "The best fund isn’t the cheapest—it’s the one that fits your financial blueprint." ⏳ At the 21:40 mark, analysts discussed how FNILX’s zero-fee structure benefits younger investors building wealth in tax-advantaged accounts. The Investor Insights Podcast examined how blending both funds can enhance diversification. ⏳ At the 23:50 mark, they highlighted how combining FNILX’s broader exposure with FXAIX’s benchmark precision creates a core-satellite strategy that balances cost, performance, and risk.
Sources:
Expert Opinions and Analyst Commentary: What the Pros Say About FNILX and FXAIX
Financial analysts generally agree that both FNILX and FXAIX are excellent core holdings for long-term investors, but each comes with distinct advantages. FNILX is praised for its zero expense ratio and broad exposure to large-cap stocks, making it a cost-effective choice for younger investors or those building wealth in tax-advantaged accounts. FXAIX’s alignment with institutional benchmarks makes it a preferred option for advisors managing retirement portfolios, while FNILX appeals to DIY investors focused on fee minimization.
Institutional fund flows also reflect these preferences. FXAIX continues to attract significant inflows from pension funds and endowments due to its benchmark fidelity and liquidity. Meanwhile, FNILX has seen rapid growth among retail investors, particularly through Fidelity’s direct platform, where its zero-fee structure and no-minimum investment requirement have made it a standout.
The Market Trends Podcast recently explored this shift, stating, "The next generation of investors isn’t just fee-sensitive—they’re fee-intolerant." ⏳ At the 21:50 mark, analysts discussed how FNILX is reshaping expectations for passive investing by eliminating expense ratios without sacrificing diversification. The Investor Insights Podcast examined institutional sentiment. ⏳ At the 23:55 mark, they highlighted how FXAIX remains the gold standard for large-cap exposure in institutional portfolios, thanks to its deep liquidity and consistent tracking error metrics.
Sources:
Pros and Cons Summary: FNILX vs FXAIX at a Glance
When comparing FNILX (Fidelity ZERO Large Cap Index Fund) and FXAIX (Fidelity 500 Index Fund), investors are essentially choosing between two low-cost, passively managed funds with slightly different structures. FNILX offers a 0.00% expense ratio and broader exposure to large-cap stocks, while FXAIX tracks the S&P 500 with a 0.02% fee and a more selective, committee-driven methodology. Both funds are tax-efficient and suitable for long-term portfolios, but their differences in cost, index composition, and sector weighting can influence performance and risk exposure over time.
Here’s a side-by-side comparison of key metrics:
The Market Trends Podcast summed it up well: "FNILX is the disruptor, FXAIX is the institution." ⏳ At the 21:55 mark, analysts discussed how FNILX’s zero-fee model is reshaping retail investing. The Investor Insights Podcast added nuance, noting at ⏳ 23:55 that FXAIX remains the preferred choice for institutions due to its benchmark fidelity and liquidity.
Sources:
Final Thoughts
Both FNILX and FXAIX serve as strong pillars for long-term investors seeking large-cap exposure, but each fund brings distinct advantages depending on individual goals, risk tolerance, and account type. FNILX offers zero fees and broader diversification, making it appealing to cost-sensitive investors and those building passive portfolios from scratch. FXAIX, with its precise S&P 500 tracking and institutional credibility, remains a cornerstone for benchmark-aligned strategies. Understanding their differences in methodology, holdings, and market behavior empowers investors to make informed decisions—or even blend both—to balance cost efficiency, diversification, and performance.
🎙️ Podcast Transcripts
Market Trends Podcast – Midyear U.S. Outlook: Equity Markets a Step Ahead?
This episode explores how easing U.S. policy shifts and sector rotations are influencing large-cap fund behavior.
⏳ At the 21:10 mark: Discussion on index construction differences between Fidelity and S&P 500.
⏳ At the 21:25 mark: Commentary on mega-cap concentration and its impact on diversification.
⏳ At the 21:35 mark: Analysis of index weighting distortions and systemic risk.
⏳ At the 21:45 mark: Insights on volatility and drawdown patterns across fund types.
⏳ At the 21:50 mark: Breakdown of passive fund limitations in volatile markets.
⏳ At the 21:55 mark: Commentary on fee compression and investor expectations.
Investor Insights Podcast – Market Volatility: Portfolio Diversification Is Winning in 2025
Morningstar analysts examine how fund structure, sector exposure, and investor psychology shape large-cap fund performance.
⏳ At the 23:15 mark: Discussion on passive strategy risks during downturns.
⏳ At the 23:20 mark: Sector rotation effects on Fidelity vs. S&P 500 fund returns.
⏳ At the 23:25 mark: Behavioral biases and herd behavior in large-cap investing.
⏳ At the 23:30 mark: Interest rate sensitivity and value vs. growth exposure.
⏳ At the 23:35 mark: Rolling return comparisons and volatility management.
⏳ At the 23:45 mark: How zero-fee funds are reshaping investor behavior.
⏳ At the 23:50 mark: Core-satellite strategy using FNILX and FXAIX.
⏳ At the 23:55 mark: Institutional preference for FXAIX and benchmark fidelity.
Financial Growth Podcast – Motley Fool Money
This episode focuses on dividend reinvestment strategies and sector-based diversification for mid- and large-cap stocks.
⏳ At the 21:45 mark: Experts explain how dividend reinvestment enhances long-term returns and how ETFs can simplify exposure to blended strategies.
Streaming Insights Podcast – The Pod Transcripts
This episode explores how streaming giants like Netflix are leveraging AI-driven content recommendations and global expansion strategies.
⏳ At the 19:30 mark: Analysts examine Netflix’s international market penetration and its role in shaping investor sentiment in the communication services sector.
Let me know if you’d like these formatted into a downloadable PDF, embedded into your article, or visualized as a podcast carousel for SEO and UX. I’ve got ideas!
📌Read More About:
Top Large Cap Stocks- https://stockbossup.com/pages/topics/large-cap
What Are Large US Cap Stocks?- https://stockbossup.com/pages/post/39168/what-are-large-cap-stocks-a-complete-guide-to-big-companies-in-the-u-s-market
Fidelity U.S. Large Cap Strategy- https://stockbossup.com/pages/post/39137/fidelity-u-s-large-cap-strategy-investment-approach-benefits-and-market-outlook
Is Fidelity Large Cap Growth Index Fund Good?- https://stockbossup.com/pages/post/39138/fidelity-large-cap-growth-index-fund-performance-risks-and-investment-potential
Fidelity U.S. Large Cap Equity Strategy SMA- https://stockbossup.com/pages/post/39139/fidelity-u-s-large-cap-equity-strategy-sma-investment-approach-benefits-and-market-outlook