Hi, I’m Jimmy, and today we’re looking at ASML (ticker symbol: ASML). ASML is traded across multiple markets, including the U.S., the Netherlands, and Germany.
In this breakdown, we’re diving into ASML’s business, reviewing some financial numbers, and determining whether ASML stock is worth investing in today. Let’s kick it off with the core segments.
ASML’s Business Segments
ASML has multiple business segments, but the simplest to look at is its services division. Here, ASML sells parts, provides machine updates, and offers repairs for its semiconductor equipment.
Now, what does ASML actually do? In short, they make machines that manufacture semiconductor chips. Their customers include industry giants like Intel, Nvidia, AMD, and Taiwan Semiconductor—all companies that use ASML’s machines to build the chips powering modern technology.
To understand ASML’s business model, it’s important to break down the machines they manufacture.
EUV vs. DUV: The Core Technologies Behind ASML’s Machines
ASML produces different machines depending on the type of semiconductor chips their customers need. Two critical types of technology define ASML’s lineup:
- EUV (Extreme Ultraviolet) – This refers to shorter-wavelength ultraviolet light, which enables the production of smaller, more precise chips.
- DUV (Deep Ultraviolet) – A slightly older technology, using longer-wavelength ultraviolet light for chip production.
Think of it like this: If you have an empty silicon chip, UV light is used to etch microscopic patterns onto it. The shorter the wavelength, the more precise and advanced the chip becomes. This is why EUV technology is essential for producing next-gen semiconductor chips—it allows companies to make smaller, faster, and more powerful processors.
What makes ASML unique is that they are currently the only company in the world producing EUV machines. This makes them a leader in semiconductor technology, especially for cutting-edge chips like 5-nanometer models. AMD is already utilizing EUV machines, while Intel is working to catch up.
High NA EUV: The Next Generation of Chip Manufacturing
ASML’s leadership in EUV technology extends even further with High NA EUV machines—a refined version of extreme ultraviolet lithography. High NA stands for High Numerical Aperture, and it fine-tunes EUV technology to produce chips smaller than 2 nanometers.
In 2024, ASML began shipping these High NA EUV machines, marking the next big leap in semiconductor production. From what ASML’s financial reports indicate:
- High NA EUV machines sell for around $350 million each.
- Standard EUV machines range between $150 million and $200 million.
- Older DUV machines cost as little as $35 million, typically used for larger-node chips from previous generations.
As expected, the better the chip, the more expensive the machinery needed to manufacture it.
ASML’s Biggest Challenge: Navigating U.S. and Dutch Trade Restrictions
Before diving into ASML’s financials, it’s critical to acknowledge the hurdles the company faces.
According to ASML’s 2024 revenue breakdown, its largest customer base is China. However, ASML operates under Dutch regulations, which—along with U.S. trade rules—restrict what technology they can sell to Chinese customers.
Here’s the restriction breakdown:
- DUV machines (Deep Ultraviolet) can still be sold freely to China.
- EUV machines (Extreme Ultraviolet) face several limitations under government regulations.
Despite restrictions, ASML continues to sell a significant amount of product to Chinese semiconductor companies. Many firms in China have adapted by purchasing ASML’s services and parts, even if they can’t buy the entire EUV machine outright. This allows them to maintain semiconductor production while working within current trade limitations.
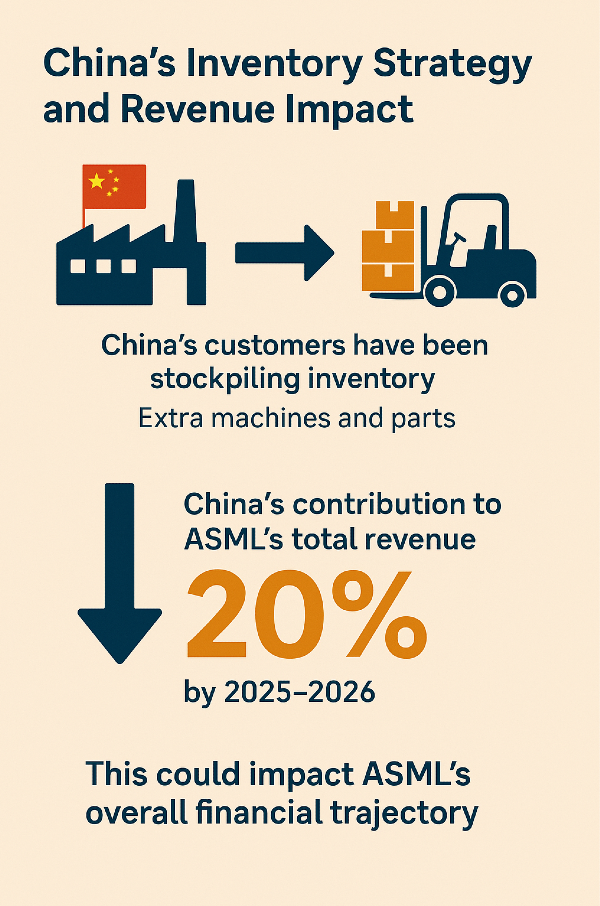
China’s Inventory Strategy and Revenue Impact
ASML’s Chinese customers have been stockpiling inventory in response to tightening trade restrictions. By preemptively ordering extra machines and parts, they aim to mitigate potential limitations on future semiconductor equipment purchases.
Analysts predict that China’s contribution to ASML’s total revenue will drop to around 20% by 2025 and 2026, which could impact ASML’s overall financial trajectory. It’s worth keeping this in mind as we assess ASML’s long-term growth prospects.
ASML’s Revenue Growth and 2023 Surge
ASML’s revenue has followed a steady upward climb over the past decade, though not at a perfectly consistent pace each year. One standout data point is 2023’s 30% revenue growth, which signals a significant jump compared to prior years.
While revenue trends look straightforward, ASML’s financial reporting becomes more complex as we dig deeper into profitability, free cash flow, and capital expenditures.
Net Income and Profit Margins
ASML’s net income has remained stable, although it hasn’t grown as consistently as revenue. That said, net income margins have drifted higher, hovering in the mid-20% range, which is impressive for a manufacturing-heavy business.
ASML’s unique pricing power plays a key role here. As the sole producer of EUV machines, ASML controls a niche market where major semiconductor companies must rely on its technology—allowing ASML to maintain favorable margins.
Share Buybacks: A Positive Indicator
ASML has been actively buying back shares, contributing to a gradual reduction in shares outstanding. This is generally a positive sign for investors, as buybacks indicate confidence in the company’s value and help boost per-share earnings.
Free Cash Flow Volatility: What’s Going On?
While revenue and net income follow relatively predictable trends, free cash flow is a different story. ASML’s cash flow data shows dramatic spikes, followed by periods of decline. These fluctuations are far from typical, raising questions about how ASML manages cash flow.
Initially, one might suspect capital expenditures (CapEx) are responsible, as ASML has expanded its footprint and invested in scaling operations. However, while CapEx has increased, it doesn’t fully explain the extreme swings in free cash flow.
Understanding ASML’s Customer Order Process
To grasp why ASML’s cash flow fluctuates so wildly, we need to examine its customer order structure. Here’s how ASML processes machine sales:
- Order Placement & Deposit – Customers place an order and provide a deposit of approximately 25–35% (estimated based on backlog trends).
- Machine Production & Shipping – Once the machine is built and shipped, customers pay an additional 60% upon delivery.
This staged payment system results in lumpy cash inflows, creating large spikes in cash flow from operations. The irregular timing of deposits and final payments explains the volatility seen in ASML’s free cash flow data.
How Should ASML Be Valued?
Given the unpredictable nature of cash flow, analysts must consider whether traditional discounted free cash flow valuation methods are appropriate. Should ASML be valued using a different approach? We’ll tackle this question in the next part of the breakdown.
Now that we’ve covered ASML’s financial trends, let’s dive deeper into how the company recognizes revenue—a critical aspect of understanding its cash flow fluctuations.
How ASML’s Machines Move Through the Payment Process
When a semiconductor company like Taiwan Semiconductor or Intel orders an ASML machine, the transaction follows a structured payment timeline:
- Initial Order & Deposit – A customer places an order, paying a deposit of around 30% of the total price.
- Manufacturing & Shipment – ASML builds the machine, which can take anywhere from 12 months to 5 years, depending on order complexity.
- Delivery Payment – Once the machine is shipped, the customer pays an additional 60% of the price.
- Final Acceptance & Revenue Recognition – After testing the machine, the customer approves the product, paying the remaining 10%, and ASML officially recognizes 100% of the revenue.
What makes this process unique is when the revenue actually appears on ASML’s financial statements. Although payments come in incrementally, ASML books the entire revenue only when the machine is officially accepted by the customer.
Financial Timing: Why Revenue Recognition Spans Multiple Years
Let’s use an example of a €100 million machine to illustrate how revenue flows through ASML’s financials:
- November 2024 – A customer places an order, paying a €30 million deposit. This amount is added to cash flow from operations, but it also creates a contract liability—ASML has received cash but is still responsible for delivering the machine.
- November 2025 – ASML completes the machine and ships it. The customer pays an additional €60 million, which again increases cash flow from operations, while maintaining the contract liability balance.
- January 2026 – The machine passes final testing and is officially accepted by the customer. At this stage, ASML books the full €100 million revenue, shifting it from contract liabilities to reported earnings.
While the cash flow trickles in gradually, revenue is recognized in one lump sum, often years after the initial order. This results in sharp jumps in revenue recognition, despite steady operational cash flow over time.
Why Free Cash Flow Dips After Revenue Is Recognized
Once ASML books revenue, cash flow from operations actually declines. Why?
When a company reports revenue under the indirect method of accounting, net income flows into the cash flow statement. However, ASML has already received most of the cash payments before recognizing revenue. So, after revenue is recorded, previously received deposits and payments are deducted from cash flow from operations—causing a temporary decline in free cash flow.
This timing nuance explains why ASML’s cash flow trends can appear volatile. Investors should factor in these accounting mechanics when evaluating the company’s financial health and valuation models.
As we continue dissecting ASML’s financials, it’s crucial to highlight how its cash flow statement works—particularly in relation to net income and inventory management.
Net Income Adjustments: Why Revenue Growth Doesn’t Equate to Cash Flow Stability
ASML’s cash flow statement follows the indirect method of accounting, meaning it starts with net income and then adjusts for various financial components.
Using our €100 million machine example, net income records the full amount of revenue upon customer acceptance, even though cash payments were received years earlier. This creates a discrepancy in cash flow from operations, making it appear as though ASML experiences wild swings in liquidity.
Why Free Cash Flow Appears Negative
At first glance, it may seem counterintuitive that ASML’s free cash flow drops when revenue is booked. But here’s why:
- The €30 million initial deposit and €60 million delivery payment were already recorded as operating cash flow in prior years.
- When ASML finally records €100 million in revenue, the prior cash inflows must be deducted to avoid double-counting.
- This results in an €80 million outflow in cash flow from operations, even though net income increases significantly in the same period.
This timing issue is not a reflection of financial deterioration, but rather a quirk in ASML’s revenue recognition structure.
The Role of Inventory Adjustments
Another factor influencing cash flow is inventory management. Ideally, companies keep inventory as lean as possible to minimize storage and carrying costs.
However, following global supply chain disruptions, ASML made the strategic decision to increase inventory levels to avoid shortages. While necessary, this temporarily reduced operating cash flow, as money was spent on materials and parts.
This further contributes to cash flow volatility, even though ASML’s overall financial health remains strong.
These nuances in cash flow timing and inventory strategy must be carefully considered when analyzing ASML’s valuation. In the next section, we’ll explore whether traditional free cash flow models are the best way to assess ASML’s fair value.
Having examined ASML’s financial intricacies, let’s now take a brief look at the competitive landscape before diving into discounted free cash flow (DCF) valuation.
ASML’s Competitive Position
ASML stands at the top of the semiconductor manufacturing machinery industry, but several competitors are vying to challenge its leadership.
Among these competitors is a Chinese company heavily backed by government funding, attempting to develop its own EUV machines to rival ASML’s technology. While they haven’t reached ASML’s level yet, significant investments suggest that competition could intensify in the coming years.
That said, ASML remains the global leader, dominating the extreme ultraviolet (EUV) market—a position that continues to reinforce its pricing power.
Discounted Free Cash Flow (DCF) Valuation
To determine ASML’s fair value, we projected cash flows over 10 years. The calculation assumes:
- Initial 10% growth, gradually tapering to 2.5% long-term growth.
- A fairly conservative approach, aligning with broader economic trends.
Based on this model, ASML’s estimated fair value per share lands at $699.
Adjusting for Cash Flow Timing
ASML’s cash flow volatility might raise concerns regarding DCF valuation accuracy. To assess this, we tested an adjustment—shifting $10 billion in projected free cash flow forward by one year.
Surprisingly, this adjustment raised fair value from $699 to $701, reinforcing a key principle:
- The time value of money makes earlier cash flows more valuable.
- Since ASML’s business model frontloads some of its free cash flow, its valuation may be slightly conservative under the standard projection.
Using Earnings Per Share to Assess Fair Value
ASML’s EPS has climbed steadily over the past decade, reinforcing its strong profitability. To gauge valuation, we can reference ASML’s historical price-to-earnings (P/E) ratio, comparing it to the industry average.
- Historical P/E multiple suggests a fair value of $773 per share.
- ASML currently trades around 26x earnings, meaning investors pay $26 for each $1 in earnings.
Compared to historical trends, ASML appears to be reasonably priced—potentially more on sale via P/E valuation than DCF estimates.
Blended Valuation Approach
Combining DCF valuation ($699) with earnings-based fair value ($773) results in a blended estimate of around $730–$740 per share.
At this level, ASML remains an attractive investment, particularly if a pullback provides an even stronger margin of safety.
Final Thoughts
ASML stands as a global leader in semiconductor manufacturing machinery, maintaining pricing power and financial strength. For long-term investors, it presents a high-quality buy-and-hold opportunity, especially near fair value.
Some Similar Stocks
Here’s a markdown table with five stocks similar to ASML, including links to their investor relations pages and stock analysis feeds.
| Company Name |
Symbol |
Why Better Than ASML |
| Taiwan Semiconductor Manufacturing Company (TSMC) |
TSM |
TSMC is the world's largest contract chipmaker, producing cutting-edge chips for Nvidia, AMD, and Apple. Unlike ASML, it directly manufactures chips, giving it broader industry exposure. |
| Applied Materials (AMAT) |
AMAT |
AMAT provides essential semiconductor equipment and materials, covering a wider range of fabrication processes than ASML, making it a more diversified play in the industry. |
| Lam Research (LRCX) |
LRCX |
Specializing in wafer fabrication equipment, Lam Research benefits from strong demand for advanced semiconductor manufacturing, offering a more direct exposure to chip production. |
| KLA Corporation (KLAC) |
KLAC |
KLA focuses on process control and yield management, ensuring semiconductor manufacturers maximize efficiency. Its niche in quality assurance makes it a critical player in the industry. |
| ASM International (ASMIY) |
ASMIY |
ASM International is a leader in atomic layer deposition (ALD) technology, which is crucial for next-gen chip fabrication. Its specialization in ALD gives it an edge in advanced semiconductor processes. |
https://youtu.be/2Uv3SFhlwS8?si=G-sp1LZMdNkvCaZM


Hi, I’m Jimmy, and today we’re looking at ASML (ticker symbol: ASML). ASML is traded across multiple markets, including the U.S., the Netherlands, and Germany.
In this breakdown, we’re diving into ASML’s business, reviewing some financial numbers, and determining whether ASML stock is worth investing in today. Let’s kick it off with the core segments.
ASML’s Business Segments
ASML has multiple business segments, but the simplest to look at is its services division. Here, ASML sells parts, provides machine updates, and offers repairs for its semiconductor equipment.
Now, what does ASML actually do? In short, they make machines that manufacture semiconductor chips. Their customers include industry giants like Intel, Nvidia, AMD, and Taiwan Semiconductor—all companies that use ASML’s machines to build the chips powering modern technology.
To understand ASML’s business model, it’s important to break down the machines they manufacture.
EUV vs. DUV: The Core Technologies Behind ASML’s Machines
ASML produces different machines depending on the type of semiconductor chips their customers need. Two critical types of technology define ASML’s lineup:
Think of it like this: If you have an empty silicon chip, UV light is used to etch microscopic patterns onto it. The shorter the wavelength, the more precise and advanced the chip becomes. This is why EUV technology is essential for producing next-gen semiconductor chips—it allows companies to make smaller, faster, and more powerful processors.
What makes ASML unique is that they are currently the only company in the world producing EUV machines. This makes them a leader in semiconductor technology, especially for cutting-edge chips like 5-nanometer models. AMD is already utilizing EUV machines, while Intel is working to catch up.
High NA EUV: The Next Generation of Chip Manufacturing
ASML’s leadership in EUV technology extends even further with High NA EUV machines—a refined version of extreme ultraviolet lithography. High NA stands for High Numerical Aperture, and it fine-tunes EUV technology to produce chips smaller than 2 nanometers.
In 2024, ASML began shipping these High NA EUV machines, marking the next big leap in semiconductor production. From what ASML’s financial reports indicate:
As expected, the better the chip, the more expensive the machinery needed to manufacture it.
ASML’s Biggest Challenge: Navigating U.S. and Dutch Trade Restrictions
Before diving into ASML’s financials, it’s critical to acknowledge the hurdles the company faces.
According to ASML’s 2024 revenue breakdown, its largest customer base is China. However, ASML operates under Dutch regulations, which—along with U.S. trade rules—restrict what technology they can sell to Chinese customers.
Here’s the restriction breakdown:
Despite restrictions, ASML continues to sell a significant amount of product to Chinese semiconductor companies. Many firms in China have adapted by purchasing ASML’s services and parts, even if they can’t buy the entire EUV machine outright. This allows them to maintain semiconductor production while working within current trade limitations.
China’s Inventory Strategy and Revenue Impact
ASML’s Chinese customers have been stockpiling inventory in response to tightening trade restrictions. By preemptively ordering extra machines and parts, they aim to mitigate potential limitations on future semiconductor equipment purchases.
Analysts predict that China’s contribution to ASML’s total revenue will drop to around 20% by 2025 and 2026, which could impact ASML’s overall financial trajectory. It’s worth keeping this in mind as we assess ASML’s long-term growth prospects.
ASML’s Revenue Growth and 2023 Surge
ASML’s revenue has followed a steady upward climb over the past decade, though not at a perfectly consistent pace each year. One standout data point is 2023’s 30% revenue growth, which signals a significant jump compared to prior years.
While revenue trends look straightforward, ASML’s financial reporting becomes more complex as we dig deeper into profitability, free cash flow, and capital expenditures.
Net Income and Profit Margins
ASML’s net income has remained stable, although it hasn’t grown as consistently as revenue. That said, net income margins have drifted higher, hovering in the mid-20% range, which is impressive for a manufacturing-heavy business.
ASML’s unique pricing power plays a key role here. As the sole producer of EUV machines, ASML controls a niche market where major semiconductor companies must rely on its technology—allowing ASML to maintain favorable margins.
Share Buybacks: A Positive Indicator
ASML has been actively buying back shares, contributing to a gradual reduction in shares outstanding. This is generally a positive sign for investors, as buybacks indicate confidence in the company’s value and help boost per-share earnings.
Free Cash Flow Volatility: What’s Going On?
While revenue and net income follow relatively predictable trends, free cash flow is a different story. ASML’s cash flow data shows dramatic spikes, followed by periods of decline. These fluctuations are far from typical, raising questions about how ASML manages cash flow.
Initially, one might suspect capital expenditures (CapEx) are responsible, as ASML has expanded its footprint and invested in scaling operations. However, while CapEx has increased, it doesn’t fully explain the extreme swings in free cash flow.
Understanding ASML’s Customer Order Process
To grasp why ASML’s cash flow fluctuates so wildly, we need to examine its customer order structure. Here’s how ASML processes machine sales:
This staged payment system results in lumpy cash inflows, creating large spikes in cash flow from operations. The irregular timing of deposits and final payments explains the volatility seen in ASML’s free cash flow data.
How Should ASML Be Valued?
Given the unpredictable nature of cash flow, analysts must consider whether traditional discounted free cash flow valuation methods are appropriate. Should ASML be valued using a different approach? We’ll tackle this question in the next part of the breakdown.
Now that we’ve covered ASML’s financial trends, let’s dive deeper into how the company recognizes revenue—a critical aspect of understanding its cash flow fluctuations.
How ASML’s Machines Move Through the Payment Process
When a semiconductor company like Taiwan Semiconductor or Intel orders an ASML machine, the transaction follows a structured payment timeline:
What makes this process unique is when the revenue actually appears on ASML’s financial statements. Although payments come in incrementally, ASML books the entire revenue only when the machine is officially accepted by the customer.
Financial Timing: Why Revenue Recognition Spans Multiple Years
Let’s use an example of a €100 million machine to illustrate how revenue flows through ASML’s financials:
While the cash flow trickles in gradually, revenue is recognized in one lump sum, often years after the initial order. This results in sharp jumps in revenue recognition, despite steady operational cash flow over time.
Why Free Cash Flow Dips After Revenue Is Recognized
Once ASML books revenue, cash flow from operations actually declines. Why?
When a company reports revenue under the indirect method of accounting, net income flows into the cash flow statement. However, ASML has already received most of the cash payments before recognizing revenue. So, after revenue is recorded, previously received deposits and payments are deducted from cash flow from operations—causing a temporary decline in free cash flow.
This timing nuance explains why ASML’s cash flow trends can appear volatile. Investors should factor in these accounting mechanics when evaluating the company’s financial health and valuation models.
As we continue dissecting ASML’s financials, it’s crucial to highlight how its cash flow statement works—particularly in relation to net income and inventory management.
Net Income Adjustments: Why Revenue Growth Doesn’t Equate to Cash Flow Stability
ASML’s cash flow statement follows the indirect method of accounting, meaning it starts with net income and then adjusts for various financial components.
Using our €100 million machine example, net income records the full amount of revenue upon customer acceptance, even though cash payments were received years earlier. This creates a discrepancy in cash flow from operations, making it appear as though ASML experiences wild swings in liquidity.
Why Free Cash Flow Appears Negative
At first glance, it may seem counterintuitive that ASML’s free cash flow drops when revenue is booked. But here’s why:
This timing issue is not a reflection of financial deterioration, but rather a quirk in ASML’s revenue recognition structure.
The Role of Inventory Adjustments
Another factor influencing cash flow is inventory management. Ideally, companies keep inventory as lean as possible to minimize storage and carrying costs.
However, following global supply chain disruptions, ASML made the strategic decision to increase inventory levels to avoid shortages. While necessary, this temporarily reduced operating cash flow, as money was spent on materials and parts.
This further contributes to cash flow volatility, even though ASML’s overall financial health remains strong.
These nuances in cash flow timing and inventory strategy must be carefully considered when analyzing ASML’s valuation. In the next section, we’ll explore whether traditional free cash flow models are the best way to assess ASML’s fair value.
Having examined ASML’s financial intricacies, let’s now take a brief look at the competitive landscape before diving into discounted free cash flow (DCF) valuation.
ASML’s Competitive Position
ASML stands at the top of the semiconductor manufacturing machinery industry, but several competitors are vying to challenge its leadership.
Among these competitors is a Chinese company heavily backed by government funding, attempting to develop its own EUV machines to rival ASML’s technology. While they haven’t reached ASML’s level yet, significant investments suggest that competition could intensify in the coming years.
That said, ASML remains the global leader, dominating the extreme ultraviolet (EUV) market—a position that continues to reinforce its pricing power.
Discounted Free Cash Flow (DCF) Valuation
To determine ASML’s fair value, we projected cash flows over 10 years. The calculation assumes:
Based on this model, ASML’s estimated fair value per share lands at $699.
Adjusting for Cash Flow Timing
ASML’s cash flow volatility might raise concerns regarding DCF valuation accuracy. To assess this, we tested an adjustment—shifting $10 billion in projected free cash flow forward by one year.
Surprisingly, this adjustment raised fair value from $699 to $701, reinforcing a key principle:
Using Earnings Per Share to Assess Fair Value
ASML’s EPS has climbed steadily over the past decade, reinforcing its strong profitability. To gauge valuation, we can reference ASML’s historical price-to-earnings (P/E) ratio, comparing it to the industry average.
Compared to historical trends, ASML appears to be reasonably priced—potentially more on sale via P/E valuation than DCF estimates.
Blended Valuation Approach
Combining DCF valuation ($699) with earnings-based fair value ($773) results in a blended estimate of around $730–$740 per share.
At this level, ASML remains an attractive investment, particularly if a pullback provides an even stronger margin of safety.
Final Thoughts
ASML stands as a global leader in semiconductor manufacturing machinery, maintaining pricing power and financial strength. For long-term investors, it presents a high-quality buy-and-hold opportunity, especially near fair value.
Some Similar Stocks
Here’s a markdown table with five stocks similar to ASML, including links to their investor relations pages and stock analysis feeds.
https://youtu.be/2Uv3SFhlwS8?si=G-sp1LZMdNkvCaZM