Below is a clear comparison of dividend-paying gold ETFs, helping you to evaluate performance, yield, and investment strategy.
Dividend-paying gold ETFs are an intriguing hybrid—offering exposure to gold’s defensive qualities while providing steady income streams for investors. Traditionally, gold is seen as a hedge against inflation, currency devaluation, and economic uncertainty, but it lacks the ability to generate cash flow. Gold ETFs that distribute dividends address this limitation by incorporating holdings in gold miners, royalty firms, and income-generating assets, making them a compelling addition to diversified portfolios. This guide will explore the mechanics of gold ETFs, highlight their advantages, and break down the best dividend-paying options in the market today. If you’re looking for a way to balance gold’s stability with consistent returns, this article will show you how to structure your investment strategy effectively.
Understanding Gold ETFs and Dividend Payments
Gold ETFs provide investors with exposure to gold prices without the need to physically own the metal. These funds track the price of gold and trade on stock exchanges, offering liquidity and ease of access. There are two primary types: physical gold ETFs, which hold gold bullion in vaults, and gold miner ETFs, which invest in companies that extract and produce gold. While physical gold ETFs directly reflect gold price movements, miner ETFs are influenced by operational efficiency, management decisions, and broader market trends.
The key distinction between these ETFs lies in their underlying assets. Physical gold ETFs, such as SPDR Gold Shares (GLD) and iShares Gold Trust (IAU), store gold in secure locations and aim to mirror gold’s spot price. Gold miner ETFs, like VanEck Vectors Gold Miners ETF (GDX), hold stocks of mining companies, which can experience price fluctuations independent of gold itself. Investors seeking direct exposure to gold often prefer physical ETFs, while those looking for growth potential may opt for miner ETFs.
Not all gold ETFs pay dividends. Physical gold ETFs do not generate income, as gold itself does not produce cash flow. However, gold miner ETFs can pay dividends, as they invest in companies that distribute earnings to shareholders. Dividend-paying gold ETFs, such as VanEck Gold Miners ETF (GDX) and iShares MSCI Global Gold Miners ETF (RING), provide investors with both exposure to gold and potential income streams. Understanding these differences helps investors align their gold ETF choices with their financial goals.
Major Dividend-Paying Gold ETFs
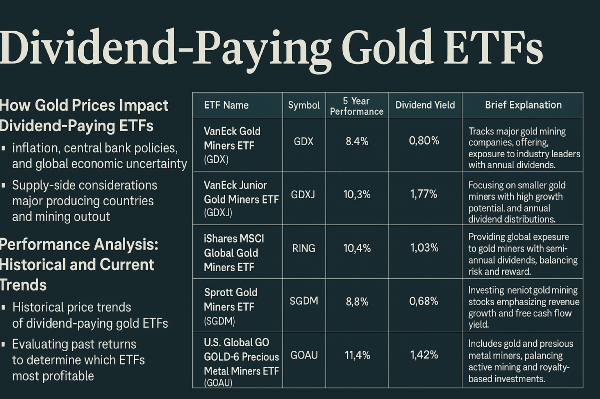
VanEck Gold Miners ETF (GDX) provides exposure to major gold mining companies and pays an annual dividend. With a dividend yield of 0.80% and a payout ratio of 15.70%, it remains a solid choice for investors seeking income from gold miners.
VanEck Junior Gold Miners ETF (GDXJ) focuses on smaller gold miners, offering a dividend yield of 1.77% and an annual payout ratio of 34.76%. This ETF provides exposure to high-growth junior mining firms while maintaining dividend distributions.
iShares MSCI Global Gold Miners ETF (RING) delivers global exposure to gold miners with semi-annual dividends. It currently holds a dividend yield of 1.0% and a payout ratio of 17.86%, making it a diversified option for investors.
Sprott Gold Miners ETF (SGDM) invests in gold mining stocks and offers annual dividend payouts. With a dividend yield of 0.69% and a payout ratio of 15.20%, it provides exposure to larger gold producers.
Sprott Junior Gold Miners ETF (SGDJ) focuses on junior gold miners, boasting a high dividend yield of 4.60% and a payout ratio of 91.53%. This ETF is ideal for investors seeking higher dividend returns from smaller mining firms.
U.S. Global GO GOLD & Precious Metal Miners ETF (GOAU) includes gold and precious metal miners with annual dividends. It currently offers a dividend yield of 1.42% and a payout ratio of 32.70%, making it a balanced option for income-focused investors.
How Gold Prices Impact Dividend-Paying ETFs
Gold prices are heavily influenced by inflation, central bank policies, and global economic uncertainty. When inflation rises, investors often turn to gold as a hedge against currency devaluation, increasing demand and driving prices higher. Central banks also play a crucial role—when they lower interest rates or engage in quantitative easing, gold becomes more attractive as a store of value. Additionally, geopolitical instability and financial crises tend to push investors toward gold, reinforcing its reputation as a safe-haven asset. These factors directly impact dividend-paying gold ETFs, as higher gold prices can boost mining revenues, leading to stronger dividend payouts.
On the supply side, major gold-producing countries and mining output significantly affect gold prices. Nations like China, Australia, Russia, and the U.S. dominate global gold production, with mining output fluctuating based on labor conditions, environmental regulations, and geopolitical tensions. Meanwhile, macroeconomic trends such as interest rates and commodity cycles shape long-term price movements. When interest rates rise, gold often struggles as investors shift toward yield-bearing assets. Conversely, during commodity super cycles—periods of prolonged price increases—gold can experience sustained growth, benefiting dividend-paying ETFs. Understanding these dynamics helps investors anticipate shifts in gold ETF performance and optimize their portfolios accordingly.
Performance Analysis: Historical and Current Trends
Performance Analysis: Historical and Current Trends
Dividend-paying gold ETFs have demonstrated strong historical performance, often mirroring gold price movements while providing additional income streams. Over the past decade, ETFs like SPDR Gold Shares (GLD) have delivered an average annual return of 5.85%, closely tracking gold’s price fluctuations. Meanwhile, VanEck Gold Miners ETF (GDX) has shown higher volatility, reflecting the cyclical nature of mining stocks. Investors seeking stability often favor physical gold ETFs, while those looking for growth potential may opt for gold miner ETFs.
The correlation between ETF movements and gold spot prices varies depending on the ETF type. Gold miner ETFs, such as VanEck Junior Gold Miners ETF (GDXJ), tend to have a moderate correlation with gold prices, as mining stocks are influenced by operational efficiency and broader market trends. In contrast, physical gold ETFs, like iShares Gold Trust (IAU), maintain a stronger correlation, as they directly track gold’s spot price. Investors should consider these differences when selecting ETFs based on risk tolerance and return expectations.
Evaluating past returns helps determine the most profitable gold ETFs. SPDR Gold Shares (GLD) posted a 1-year return of 22.95% in 2023, rebounding from a minor setback in 2022. VanEck Gold Miners ETF (GDX) and iShares MSCI Global Gold Miners ETF (RING) have also delivered consistent returns, benefiting from rising gold prices and strong mining sector performance. Investors should analyze historical trends, dividend yields, and payout ratios to optimize their gold ETF investments. Let me know if you need further refinements!
Conclusion
Dividend-paying gold ETFs offer a unique blend of gold exposure and income generation, making them a compelling choice for investors seeking diversification. While gold itself lacks cash flow, ETFs that invest in gold miners provide dividends that enhance portfolio returns. Understanding macroeconomic factors, historical performance, and payout strategies is crucial to selecting the right ETF for your goals. Whether you're hedging against inflation or optimizing for yield, a well-balanced gold ETF strategy can strengthen your long-term investment approach.
Material Stocks Quick Find List 🚀
Discover more about the material sector with our collection of in depth market exploration and and hot investment topics.
General 🌟
Construction Stocks 🏗️
Lumber Stocks 🌲
International Material Stocks 🌍
Metal Stocks ⚙️
Aluminum Stocks ✨
Steel Stocks 💪
Precious Metal Stocks 💎
Material Stocks with Dividends 🎯
Industrial Gas Stocks 🚀
Rare Earth Stocks 🌐
Advanced Materials 🔬


Dividend-paying gold ETFs are an intriguing hybrid—offering exposure to gold’s defensive qualities while providing steady income streams for investors. Traditionally, gold is seen as a hedge against inflation, currency devaluation, and economic uncertainty, but it lacks the ability to generate cash flow. Gold ETFs that distribute dividends address this limitation by incorporating holdings in gold miners, royalty firms, and income-generating assets, making them a compelling addition to diversified portfolios. This guide will explore the mechanics of gold ETFs, highlight their advantages, and break down the best dividend-paying options in the market today. If you’re looking for a way to balance gold’s stability with consistent returns, this article will show you how to structure your investment strategy effectively.
Understanding Gold ETFs and Dividend Payments
Gold ETFs provide investors with exposure to gold prices without the need to physically own the metal. These funds track the price of gold and trade on stock exchanges, offering liquidity and ease of access. There are two primary types: physical gold ETFs, which hold gold bullion in vaults, and gold miner ETFs, which invest in companies that extract and produce gold. While physical gold ETFs directly reflect gold price movements, miner ETFs are influenced by operational efficiency, management decisions, and broader market trends.
The key distinction between these ETFs lies in their underlying assets. Physical gold ETFs, such as SPDR Gold Shares (GLD) and iShares Gold Trust (IAU), store gold in secure locations and aim to mirror gold’s spot price. Gold miner ETFs, like VanEck Vectors Gold Miners ETF (GDX), hold stocks of mining companies, which can experience price fluctuations independent of gold itself. Investors seeking direct exposure to gold often prefer physical ETFs, while those looking for growth potential may opt for miner ETFs.
Not all gold ETFs pay dividends. Physical gold ETFs do not generate income, as gold itself does not produce cash flow. However, gold miner ETFs can pay dividends, as they invest in companies that distribute earnings to shareholders. Dividend-paying gold ETFs, such as VanEck Gold Miners ETF (GDX) and iShares MSCI Global Gold Miners ETF (RING), provide investors with both exposure to gold and potential income streams. Understanding these differences helps investors align their gold ETF choices with their financial goals.
Major Dividend-Paying Gold ETFs
VanEck Gold Miners ETF (GDX) provides exposure to major gold mining companies and pays an annual dividend. With a dividend yield of 0.80% and a payout ratio of 15.70%, it remains a solid choice for investors seeking income from gold miners.
VanEck Junior Gold Miners ETF (GDXJ) focuses on smaller gold miners, offering a dividend yield of 1.77% and an annual payout ratio of 34.76%. This ETF provides exposure to high-growth junior mining firms while maintaining dividend distributions.
iShares MSCI Global Gold Miners ETF (RING) delivers global exposure to gold miners with semi-annual dividends. It currently holds a dividend yield of 1.0% and a payout ratio of 17.86%, making it a diversified option for investors.
Sprott Gold Miners ETF (SGDM) invests in gold mining stocks and offers annual dividend payouts. With a dividend yield of 0.69% and a payout ratio of 15.20%, it provides exposure to larger gold producers.
Sprott Junior Gold Miners ETF (SGDJ) focuses on junior gold miners, boasting a high dividend yield of 4.60% and a payout ratio of 91.53%. This ETF is ideal for investors seeking higher dividend returns from smaller mining firms.
U.S. Global GO GOLD & Precious Metal Miners ETF (GOAU) includes gold and precious metal miners with annual dividends. It currently offers a dividend yield of 1.42% and a payout ratio of 32.70%, making it a balanced option for income-focused investors.
How Gold Prices Impact Dividend-Paying ETFs
Gold prices are heavily influenced by inflation, central bank policies, and global economic uncertainty. When inflation rises, investors often turn to gold as a hedge against currency devaluation, increasing demand and driving prices higher. Central banks also play a crucial role—when they lower interest rates or engage in quantitative easing, gold becomes more attractive as a store of value. Additionally, geopolitical instability and financial crises tend to push investors toward gold, reinforcing its reputation as a safe-haven asset. These factors directly impact dividend-paying gold ETFs, as higher gold prices can boost mining revenues, leading to stronger dividend payouts.
On the supply side, major gold-producing countries and mining output significantly affect gold prices. Nations like China, Australia, Russia, and the U.S. dominate global gold production, with mining output fluctuating based on labor conditions, environmental regulations, and geopolitical tensions. Meanwhile, macroeconomic trends such as interest rates and commodity cycles shape long-term price movements. When interest rates rise, gold often struggles as investors shift toward yield-bearing assets. Conversely, during commodity super cycles—periods of prolonged price increases—gold can experience sustained growth, benefiting dividend-paying ETFs. Understanding these dynamics helps investors anticipate shifts in gold ETF performance and optimize their portfolios accordingly.
Performance Analysis: Historical and Current Trends
Performance Analysis: Historical and Current Trends
Dividend-paying gold ETFs have demonstrated strong historical performance, often mirroring gold price movements while providing additional income streams. Over the past decade, ETFs like SPDR Gold Shares (GLD) have delivered an average annual return of 5.85%, closely tracking gold’s price fluctuations. Meanwhile, VanEck Gold Miners ETF (GDX) has shown higher volatility, reflecting the cyclical nature of mining stocks. Investors seeking stability often favor physical gold ETFs, while those looking for growth potential may opt for gold miner ETFs.
The correlation between ETF movements and gold spot prices varies depending on the ETF type. Gold miner ETFs, such as VanEck Junior Gold Miners ETF (GDXJ), tend to have a moderate correlation with gold prices, as mining stocks are influenced by operational efficiency and broader market trends. In contrast, physical gold ETFs, like iShares Gold Trust (IAU), maintain a stronger correlation, as they directly track gold’s spot price. Investors should consider these differences when selecting ETFs based on risk tolerance and return expectations.
Evaluating past returns helps determine the most profitable gold ETFs. SPDR Gold Shares (GLD) posted a 1-year return of 22.95% in 2023, rebounding from a minor setback in 2022. VanEck Gold Miners ETF (GDX) and iShares MSCI Global Gold Miners ETF (RING) have also delivered consistent returns, benefiting from rising gold prices and strong mining sector performance. Investors should analyze historical trends, dividend yields, and payout ratios to optimize their gold ETF investments. Let me know if you need further refinements!
Conclusion
Dividend-paying gold ETFs offer a unique blend of gold exposure and income generation, making them a compelling choice for investors seeking diversification. While gold itself lacks cash flow, ETFs that invest in gold miners provide dividends that enhance portfolio returns. Understanding macroeconomic factors, historical performance, and payout strategies is crucial to selecting the right ETF for your goals. Whether you're hedging against inflation or optimizing for yield, a well-balanced gold ETF strategy can strengthen your long-term investment approach.
Material Stocks Quick Find List 🚀
Discover more about the material sector with our collection of in depth market exploration and and hot investment topics.
General 🌟
Construction Stocks 🏗️
Lumber Stocks 🌲
International Material Stocks 🌍
Metal Stocks ⚙️
Aluminum Stocks ✨
Steel Stocks 💪
Precious Metal Stocks 💎
Material Stocks with Dividends 🎯
Industrial Gas Stocks 🚀
Rare Earth Stocks 🌐
Advanced Materials 🔬