May 5, 2023 – Well we’re about half the way back from the Low (Oct. 2022) to the previous High (Nov. 2021). The top of the “green box” / trading range shows that level around 12270 on the NASDAQ Composite Index. Next week will be interesting to see how traders react now that most of the earnings reports are behind us. Is the “cup half empty or half full?” Is the Banking Crisis behind us? Will Ukraine begin a counter offensive & how will Putin react?
I see two scenarios. First, a false breakout above 12270 for a couple of days then a fall back into the trading range with little progress. The other is a breakout higher, a minor pullback for a pause, a grind higher for another 5% or so and then a consolidation into the summer.
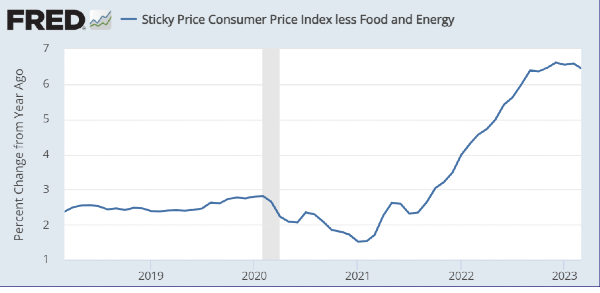
Earnings were generally good with stock buybacks buoying stocks, but the forward guidance was muted. The economy is slowing though not as fast as the FED would like. The market is trying hard to anticipate a rate pause followed by a rate drop in the Fall. But so far there just are no strong signs of any of that wishful thinking. Here’s a chart of inflation from the St. Louis FED to put things in perspective.
I’ve talked about how a few large corporations have kept the indexes strong. The pie chart shows the percent of stocks in the S&P 1500 Index that are above their 20 day moving averages and just how far above / below they are. A pretty mixed sign with it favoring more weakness than a strong move higher.
Overall, I’m long term Bullish but I think that’s it is going to take a lot longer than people think. There is no “V Shaped Recovery” in the cards just a long drawn out process with things slowing down over the summer months.
What is showing at least some near term strength? I see BioTech and India, with Precious Metals and Mexico in the mix but they are rather extended and may be due for a correction. That’s it for this week. Take Care and have a good week. ………….. Tom ……………
Referred Charts at: www.Special-Risk.net .
Price chart by MetaStock; pie chart & table by www.HighGrowthStock.com. Used with permission.


May 5, 2023 – Well we’re about half the way back from the Low (Oct. 2022) to the previous High (Nov. 2021). The top of the “green box” / trading range shows that level around 12270 on the NASDAQ Composite Index. Next week will be interesting to see how traders react now that most of the earnings reports are behind us. Is the “cup half empty or half full?” Is the Banking Crisis behind us? Will Ukraine begin a counter offensive & how will Putin react?
I see two scenarios. First, a false breakout above 12270 for a couple of days then a fall back into the trading range with little progress. The other is a breakout higher, a minor pullback for a pause, a grind higher for another 5% or so and then a consolidation into the summer. Earnings were generally good with stock buybacks buoying stocks, but the forward guidance was muted. The economy is slowing though not as fast as the FED would like. The market is trying hard to anticipate a rate pause followed by a rate drop in the Fall. But so far there just are no strong signs of any of that wishful thinking. Here’s a chart of inflation from the St. Louis FED to put things in perspective.
I’ve talked about how a few large corporations have kept the indexes strong. The pie chart shows the percent of stocks in the S&P 1500 Index that are above their 20 day moving averages and just how far above / below they are. A pretty mixed sign with it favoring more weakness than a strong move higher.
Overall, I’m long term Bullish but I think that’s it is going to take a lot longer than people think. There is no “V Shaped Recovery” in the cards just a long drawn out process with things slowing down over the summer months.
What is showing at least some near term strength? I see BioTech and India, with Precious Metals and Mexico in the mix but they are rather extended and may be due for a correction. That’s it for this week. Take Care and have a good week. ………….. Tom ……………
Referred Charts at: www.Special-Risk.net .
Price chart by MetaStock; pie chart & table by www.HighGrowthStock.com. Used with permission.