Sound investments
don't happen alone
Find your crew, build teams, compete in VS MODE, and identify investment trends in our evergrowing investment ecosystem. You aren't on an island anymore, and our community is here to help you make informed decisions in a complex world.











Confirmation of a Breakout ?
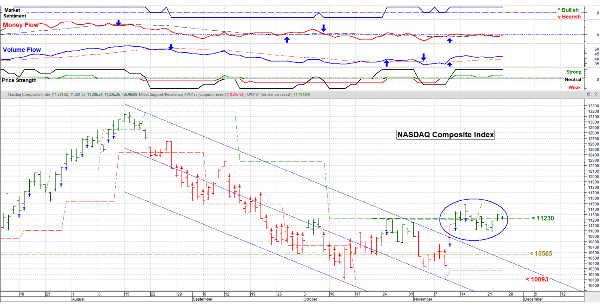
Nov. 25, 2022 – This was a short week with very light holiday volume, so I’ll get to the point. Note the chart below of the NASDAQ Composite Index. I’ve drawn in a linear regression line with a +/- 2 standard deviation channel. The linear regression line is basically the graphical average between the last peak in mid-August and the last low in early October; half of the “area” (time & price) is above and half is below. Think of +/- 2 standard deviation channel as an “expected move” within that time frame of “typical”.
The blue ellipse shows a breakout from that “expected move” and thus a possible change in character / trend. But . . .we haven’t seen that follow through yet.
All eyes will be on economic news in the coming 2 weeks: 12-1: the PCE report (Personal Consumption & Expenditures)
12-13: the CPI report (Consumer Price Index) 12-14: the FOMC / Fed meeting
For those trying to front run the economy, interest rates and inflation, these are the ones to possibly show a change in behavior. Until then the strength / weakness in the US Dollar and Treasury Bonds will provide some indications of where the money is wagered. Nuff said. Have a good week. ………… Tom …………..
Price chart by MetaStock. Used with permission.