The most important development in foreign exchange probably took place in the interest rate market last week. A series of disappointing US economic data and the Fed's "unconditional" commitment to rein in inflation have heightened concerns that economic weakness will limit the Fed's ability to hike rates.
Specifically, for the first time, the implied yield of the December 2023 Fed funds futures contract is below the December 2022 yield. In fact, the gap implies a rate cut in Q4 23. Moreover, the peak in Fed funds is now seen near around 3.5% in Q1 23. The peak is lower and earlier than the market expected after the FOMC meeting that resulted in a 75 bp hike on June 15.
This seems to be a necessary pre-condition of the end of the dollar's rally. We have noted that the euro topped, and the yen and the Dollar Index bottomed on 6 January 2021 that same day that has been the focus of congressional hearings, which have underscored how close America came to a genuine constitutional crisis. The dollar's rally since has arguably been fueled by growth and interest rate differentials. The fodder for the cyclical advance seems to be running thin. That said, recognizing that that turning point in the foreign exchange market is more about a process than a moment in time, we need to be careful of getting too far ahead of ourselves. One is still paid to be long dollars. The news stream from Europe, where another intense energy shock is unfolding, is poor, and while the Japanese economy is recovering, it is not going anywhere quickly. The BOJ insists that its CPI, which was above 2% for the second consecutive month in May is not sustainable (i.e., transitory). Economists seem to agree and excluding fresh food and energy, Japan's inflation is remains below 1%. With that in mind, let us turn to the recent price action, remembering there is no substitute for disciplined risk management.
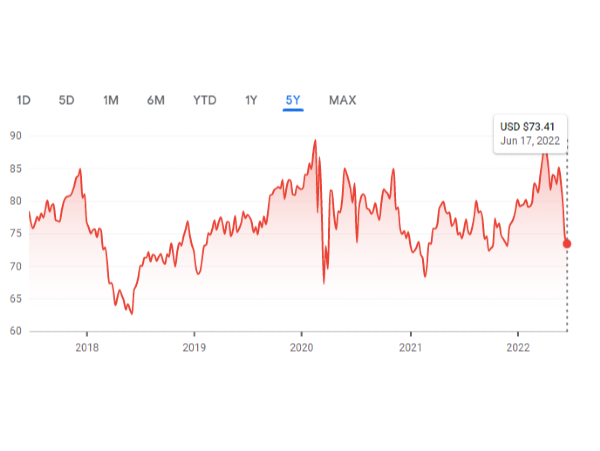
Dollar Index: DXY traded in a wide range roughly between 103.40 and 105.50 the day after the Fed hiked rates. That range has been maintained. In the middle of last week, the Dollar Index's range was about 103.85-105.00 and the price action over the past two sessions was confined to that somewhat narrower range. It feels like a spring coiling and the triangle that has been carved is often seen as a continuation pattern. However, it may be getting too close to the apex to be valid. The MACD is flatlining near mid-range, while the Slow Stochastic is falling. On the weekly charts, the MACD is extremely over-extended as appears poised to turn lower, while the Slow Stochastic has already moved lower. A break of the 103.40 area, the recent low and the five-week moving average, is needed to give more credence to a high being in place.
Euro: The single currency flirted with the $1.06 area last week, the same area that was probed the day after the mid-June FOMC meeting. It held, and the euro has not closed above it since June 9. The rising gas prices in Europe, weaker PMI survey data, and broader cost-of-living squeeze is fanning fears of a recession. The ECB's new tool to resist fragmentation also weighed on interest rates. Even though the US 2-year yield fell 11 bp as Fed views are adjusted, the two-year yield in Germany fell by around 30 bp last week and Italy's two-year yield fell by around 21 bp. The net effect was to increase the German discount to the US for the third consecutive week. Over the run, the rate differential widened to almost 225 bp from 200 bp. It peaked in April near 255 bp. The Slow Stochastic bounced off the lows but is at risk of stalling. A few days after the ECB meeting, expectations tightening peaked. The swaps market had the year-end rate of about 1.20%. By the end of last week, it stood slightly above 0.90%. The MACD is gently rising. A close above $1.06 is needed to lift the technical tone.
Japanese Yen: The nearly 50 bp decline in the US 10-year yield from peak (June 14, ~3.50%) to the trough (June 23, ~3.0%) took some pressure off the yen in recent days. Still, the dollar finished slightly above JPY135, for the fourth consecutive weekly advance. Japanese officials continue to warn about the volatility, and a former official cautioned against ruling out unilateral intervention. Many, including ourselves, are skeptical that the threat will be made good. The MACD appears to be rolling over and the Slow Stochastic has flatlined in over-bought territory. A break of the JPY133.50 could open the door to a two-yen decline. On the upside, a move above the JPY136.70 high would lift the tone and target the JPY138 area.
British Pound: Sterling is faring better than the deterioration of economic data might suggest is warranted. Consumer confidence (GfK) fell to record lows, retail sales fell again after rising in April amid the most severe cost of living squeeze in a generation. Sterling has gone nowhere since June 16, the day after the FOMC hike. It has been confined to the range seen that day (~$1.2040-$1.2405). Indeed, the price action is even in a narrower range, roughly $1.2160-$1.2325. It finished the week near the upper end of that range. Still, sterling needs to rise above the $1.2375-$1.2400 to improve the technical tone. However, more important, is the four-month downtrend that starts next week near $1.2470. The momentum indicators are not generating strong signals as sterling trades around the middle of the month's range. The broad dollar direction may be more important than the high-frequency data reports. The swaps market had implied a year-end rate of almost 3.10% at the start or last week and finished near 2.80%.
Canadian Dollar: The US dollar set a marginal new high for the year against the Canadian dollar on June 17. The main weight on the Canadian dollar appeared to stem from the risk-off action that saw the S&P 500 slide by almost 11% in the two weeks through June 17. A sharp recovery (5%+) last week helped drive the US dollar back below support near CAD1.29 area of the weekend. While the Canadian dollar's prospects appear to have improved, a break of CAD1.2860 would confirm the topping pattern. It would suggest potential back toward CAD1.2600. Before getting there, initial support may be seen around CAD1.2780-CAD1.2800. The momentum indicators are rolling over, giving it scope for follow-through US dollar selling next week. The note of caution is that just like the Fed funds futures, Canada's Banker Acceptances futures contracts have also begun pricing in a cut late next year.
Australian Dollar: The Aussie's pre-weekend advance of around 0.7% offset the losses recorded earlier in the week. By closing higher on the week, it snapped a two-week 3.85% decline. On June 23, it approached the low from the previous week (~$0.6850) and the recovery the following day helped the technical tone. A band of resistance ($0.6975-$0.7000) must be overcome to improve the outlook. The momentum indicators are not generating strong signals, and commodities (e.g., gold, copper, iron ore, oil) have weakened. The 2-year interest rate premium on June 17 of 13 bp fell every day last week to finish at a discount of nearly 30 bp. The swaps market had seen the year-end rate near 3.50% on June 15. At the end of last week, it was a little below 3.20%. Nevertheless, the price action is what would be expected if a bottom were being carved.
Mexican Peso: The peso will begin next week with a six-day rally in tow. Over the run, the peso has appreciated by 2.7% and was the world strongest currency, excluding the Russian rouble (+5.4%). News that the US is pushing harder against Mexico's nationalist energy plans for violating the free-trade agreement did not derail the peso's rally. It is interesting too because reports suggest the Biden administration is considering a ban on oil/gasoline exports to reduce domestic inflation as Congress is likely to balk at the President's request for a gasoline tax holiday. The US dollar's pullback met the (61.8%) retracement objective of the gains scored off the late May low (~MXN19.41) as it fell to MXN19.8270 ahead of the weekend. The next interesting technical area is around MXN19.77 and then MXN19.60. The MACD and Slow Stochastics have turned lower, supporting the negative view of the greenback.
Chinese Yuan: The US dollar rose 7.4% against the Chinese yuan from April 1 through mid-May. It has since moved broadly sideway between CNY6.64 and CNY6.76. Most recently, it has been in a narrow CNY6.67-CNY6.72 range. What is most striking and contrary to what many observers expected, China has taken sharp depreciation of the yen in stride. The yuan rose above the 2015 highs in recent days to reach its best level against the yen since the early 1990s. It would seem Beijing is more concerned about the dollar-yuan exchange rate that the yen-yuan rate. The pullback in US yields has seen the premium over China halved last week to below 30 bp from over 65 bp on the eve of the Fed's 75 bp hike. Within the broader consolidation against the dollar, we see scope for the yuan to appreciate, especially if the composite PMI validates ideas that a recovery is taking hold by moving above the 50 boom/bust level for the first time since February.
Originally published on Sunday, June 26th 2022 on marctomarket.com


The most important development in foreign exchange probably took place in the interest rate market last week. A series of disappointing US economic data and the Fed's "unconditional" commitment to rein in inflation have heightened concerns that economic weakness will limit the Fed's ability to hike rates.
Specifically, for the first time, the implied yield of the December 2023 Fed funds futures contract is below the December 2022 yield. In fact, the gap implies a rate cut in Q4 23. Moreover, the peak in Fed funds is now seen near around 3.5% in Q1 23. The peak is lower and earlier than the market expected after the FOMC meeting that resulted in a 75 bp hike on June 15.
This seems to be a necessary pre-condition of the end of the dollar's rally. We have noted that the euro topped, and the yen and the Dollar Index bottomed on 6 January 2021 that same day that has been the focus of congressional hearings, which have underscored how close America came to a genuine constitutional crisis. The dollar's rally since has arguably been fueled by growth and interest rate differentials. The fodder for the cyclical advance seems to be running thin. That said, recognizing that that turning point in the foreign exchange market is more about a process than a moment in time, we need to be careful of getting too far ahead of ourselves. One is still paid to be long dollars. The news stream from Europe, where another intense energy shock is unfolding, is poor, and while the Japanese economy is recovering, it is not going anywhere quickly. The BOJ insists that its CPI, which was above 2% for the second consecutive month in May is not sustainable (i.e., transitory). Economists seem to agree and excluding fresh food and energy, Japan's inflation is remains below 1%. With that in mind, let us turn to the recent price action, remembering there is no substitute for disciplined risk management.
Dollar Index: DXY traded in a wide range roughly between 103.40 and 105.50 the day after the Fed hiked rates. That range has been maintained. In the middle of last week, the Dollar Index's range was about 103.85-105.00 and the price action over the past two sessions was confined to that somewhat narrower range. It feels like a spring coiling and the triangle that has been carved is often seen as a continuation pattern. However, it may be getting too close to the apex to be valid. The MACD is flatlining near mid-range, while the Slow Stochastic is falling. On the weekly charts, the MACD is extremely over-extended as appears poised to turn lower, while the Slow Stochastic has already moved lower. A break of the 103.40 area, the recent low and the five-week moving average, is needed to give more credence to a high being in place.
Euro: The single currency flirted with the $1.06 area last week, the same area that was probed the day after the mid-June FOMC meeting. It held, and the euro has not closed above it since June 9. The rising gas prices in Europe, weaker PMI survey data, and broader cost-of-living squeeze is fanning fears of a recession. The ECB's new tool to resist fragmentation also weighed on interest rates. Even though the US 2-year yield fell 11 bp as Fed views are adjusted, the two-year yield in Germany fell by around 30 bp last week and Italy's two-year yield fell by around 21 bp. The net effect was to increase the German discount to the US for the third consecutive week. Over the run, the rate differential widened to almost 225 bp from 200 bp. It peaked in April near 255 bp. The Slow Stochastic bounced off the lows but is at risk of stalling. A few days after the ECB meeting, expectations tightening peaked. The swaps market had the year-end rate of about 1.20%. By the end of last week, it stood slightly above 0.90%. The MACD is gently rising. A close above $1.06 is needed to lift the technical tone.
Japanese Yen: The nearly 50 bp decline in the US 10-year yield from peak (June 14, ~3.50%) to the trough (June 23, ~3.0%) took some pressure off the yen in recent days. Still, the dollar finished slightly above JPY135, for the fourth consecutive weekly advance. Japanese officials continue to warn about the volatility, and a former official cautioned against ruling out unilateral intervention. Many, including ourselves, are skeptical that the threat will be made good. The MACD appears to be rolling over and the Slow Stochastic has flatlined in over-bought territory. A break of the JPY133.50 could open the door to a two-yen decline. On the upside, a move above the JPY136.70 high would lift the tone and target the JPY138 area.
British Pound: Sterling is faring better than the deterioration of economic data might suggest is warranted. Consumer confidence (GfK) fell to record lows, retail sales fell again after rising in April amid the most severe cost of living squeeze in a generation. Sterling has gone nowhere since June 16, the day after the FOMC hike. It has been confined to the range seen that day (~$1.2040-$1.2405). Indeed, the price action is even in a narrower range, roughly $1.2160-$1.2325. It finished the week near the upper end of that range. Still, sterling needs to rise above the $1.2375-$1.2400 to improve the technical tone. However, more important, is the four-month downtrend that starts next week near $1.2470. The momentum indicators are not generating strong signals as sterling trades around the middle of the month's range. The broad dollar direction may be more important than the high-frequency data reports. The swaps market had implied a year-end rate of almost 3.10% at the start or last week and finished near 2.80%.
Canadian Dollar: The US dollar set a marginal new high for the year against the Canadian dollar on June 17. The main weight on the Canadian dollar appeared to stem from the risk-off action that saw the S&P 500 slide by almost 11% in the two weeks through June 17. A sharp recovery (5%+) last week helped drive the US dollar back below support near CAD1.29 area of the weekend. While the Canadian dollar's prospects appear to have improved, a break of CAD1.2860 would confirm the topping pattern. It would suggest potential back toward CAD1.2600. Before getting there, initial support may be seen around CAD1.2780-CAD1.2800. The momentum indicators are rolling over, giving it scope for follow-through US dollar selling next week. The note of caution is that just like the Fed funds futures, Canada's Banker Acceptances futures contracts have also begun pricing in a cut late next year.
Australian Dollar: The Aussie's pre-weekend advance of around 0.7% offset the losses recorded earlier in the week. By closing higher on the week, it snapped a two-week 3.85% decline. On June 23, it approached the low from the previous week (~$0.6850) and the recovery the following day helped the technical tone. A band of resistance ($0.6975-$0.7000) must be overcome to improve the outlook. The momentum indicators are not generating strong signals, and commodities (e.g., gold, copper, iron ore, oil) have weakened. The 2-year interest rate premium on June 17 of 13 bp fell every day last week to finish at a discount of nearly 30 bp. The swaps market had seen the year-end rate near 3.50% on June 15. At the end of last week, it was a little below 3.20%. Nevertheless, the price action is what would be expected if a bottom were being carved.
Mexican Peso: The peso will begin next week with a six-day rally in tow. Over the run, the peso has appreciated by 2.7% and was the world strongest currency, excluding the Russian rouble (+5.4%). News that the US is pushing harder against Mexico's nationalist energy plans for violating the free-trade agreement did not derail the peso's rally. It is interesting too because reports suggest the Biden administration is considering a ban on oil/gasoline exports to reduce domestic inflation as Congress is likely to balk at the President's request for a gasoline tax holiday. The US dollar's pullback met the (61.8%) retracement objective of the gains scored off the late May low (~MXN19.41) as it fell to MXN19.8270 ahead of the weekend. The next interesting technical area is around MXN19.77 and then MXN19.60. The MACD and Slow Stochastics have turned lower, supporting the negative view of the greenback.
Chinese Yuan: The US dollar rose 7.4% against the Chinese yuan from April 1 through mid-May. It has since moved broadly sideway between CNY6.64 and CNY6.76. Most recently, it has been in a narrow CNY6.67-CNY6.72 range. What is most striking and contrary to what many observers expected, China has taken sharp depreciation of the yen in stride. The yuan rose above the 2015 highs in recent days to reach its best level against the yen since the early 1990s. It would seem Beijing is more concerned about the dollar-yuan exchange rate that the yen-yuan rate. The pullback in US yields has seen the premium over China halved last week to below 30 bp from over 65 bp on the eve of the Fed's 75 bp hike. Within the broader consolidation against the dollar, we see scope for the yuan to appreciate, especially if the composite PMI validates ideas that a recovery is taking hold by moving above the 50 boom/bust level for the first time since February.
Originally published on Sunday, June 26th 2022 on marctomarket.com