Sound investments
don't happen alone
Find your crew, build teams, compete in VS MODE, and identify investment trends in our evergrowing investment ecosystem. You aren't on an island anymore, and our community is here to help you make informed decisions in a complex world.







June 24, 2022 - Last week was a good week for the stock market with some hopeful signs beginning to show. The markets are oversold so that nice bounce on Friday was somewhat expected. What is interesting was the very high volume on Friday. This was likely caused but “short squeezes”, that is people who were short stocks and then having to buy them back to cover their short positions (to avoid losses); a.k.a. “buying begets buying”.
But another factor is there remains billions of dollars in Put options and some of them expired on Friday. The question is did these contracts “roll forward” (in time) or did they cover/close? Lastly, we are approaching the end of the quarter and many funds will begin to rebalance their portfolios per their charters. We’ll have a better idea on Monday.
There has been extreme investor pessimism and there are very early signs that the Technology and growth stocks are beginning to at least stabilize. I still favor a possible bottoming and basing formation over the next 6-8 weeks. That process could be a positive if strength returns, or . . . if economies don’t show some improvements, a set up for another leg down that would be a flushing out and capitulation phase. That basing area could be between 12290 at the top and 10560 at the bottom (NASDAQ Composite Index).
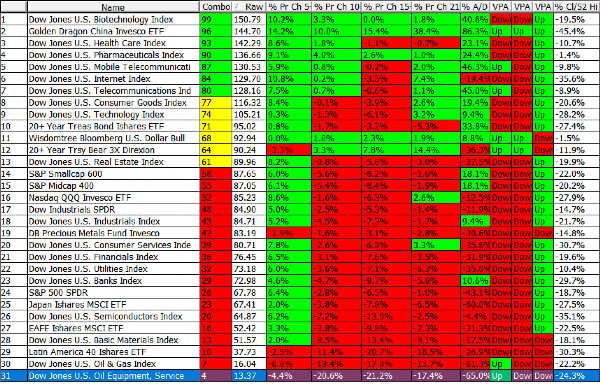
The Short Term Sector Strength table shows what a difference a week makes. Energy at the bottom and select Technology sectors moving toward the top. Note the strength in Chinese stocks.
The bottom line is really no change, we continue to be in a Bear market but we must also be open to that will eventually change. The question is when, and it will likely take time over months. I’m watching for a base and “stopping action” to form. Have a good week. ………… Tom ………. more data at: www.special-risk.net
Price chart by MetaStock; table by www.HighGrowthStock.com. Used with permission.