Should You Buy Red or Green Stocks?
You should never buy a stock based on the color of a stock alone. Typically, a stock that is green indicates it is increasing in value today. A red colored stock is going down today.
The Trend is Your Friend?
Research indicates that momentum strategies can outperform the market. This strategy buys stocks that are going up in the last 12 month period and sells stocks that have performed poorly in the last 12 month period. These strategies capitalize on companies with strong cultures performing consistently month after month and the movement of capital to a few key winners in the market; however, there is no consensus on why momentum strategies work.
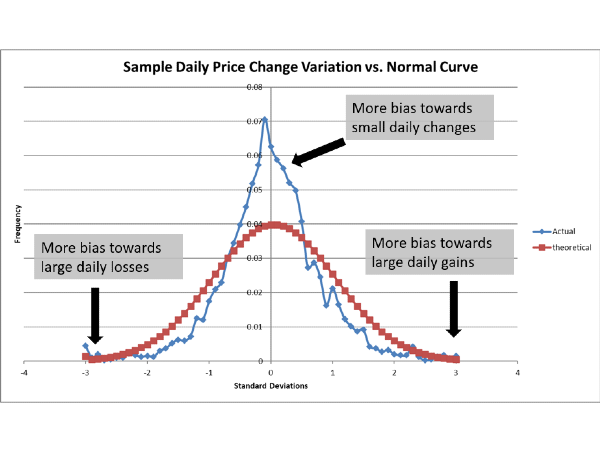
There is clear evidence that a stock's daily change is in line with random behavior, with the caveat that the kurtosis of the daily random motion of a stock is poor with large tails indicating significant moves up and down are more common than should occur randomly. This bias towards larger moves up and down may also be the reason that momentum strategies are an effective strategy.
Why You Should Not Buy Stocks Based on Daily Change
You should not buy a stock because it is green or red because there is no correlation between the daily change of a stock today and its future movement tomorrow. The distribution of a stock's daily change can be modeled as random motion with bias towards extreme movements up and down. Even though a stock's daily price movement is bias towards more extreme upwards movement, there is no indication that a big price move today predicts a big price move tomorrow.
What does Green and Red Mean in Candlestick Charts
Candlestick charts show green if the stock went up in a given period and red if the stock went down in a given period. The "wicks" of the candle sticks show the high and low prices during the period. The period is typically five minutes or one day.
Candlestick charts are heavily used in technical analysis to identify trading patterns in day trading. Identifying patterns in technical analysis can be very profitable, but the simple plan of buying when the candlesticks are green and selling when the candlesticks are red will not yield consistent positive returns.
Check out Tom Hamilton's analysis using technical analysis to learn more about interpreting technical chart patterns.
Guidance for Beginning Investors
For new investors, check out our new investor tips guide as well as our ultimate guide for beginning investors. Even though investing based on a stock's color is discouraged, here are some tips for new investors that will help your portfolio:


Should You Buy Red or Green Stocks?
You should never buy a stock based on the color of a stock alone. Typically, a stock that is green indicates it is increasing in value today. A red colored stock is going down today.
The Trend is Your Friend?
Research indicates that momentum strategies can outperform the market. This strategy buys stocks that are going up in the last 12 month period and sells stocks that have performed poorly in the last 12 month period. These strategies capitalize on companies with strong cultures performing consistently month after month and the movement of capital to a few key winners in the market; however, there is no consensus on why momentum strategies work.
There is clear evidence that a stock's daily change is in line with random behavior, with the caveat that the kurtosis of the daily random motion of a stock is poor with large tails indicating significant moves up and down are more common than should occur randomly. This bias towards larger moves up and down may also be the reason that momentum strategies are an effective strategy.
Why You Should Not Buy Stocks Based on Daily Change
You should not buy a stock because it is green or red because there is no correlation between the daily change of a stock today and its future movement tomorrow. The distribution of a stock's daily change can be modeled as random motion with bias towards extreme movements up and down. Even though a stock's daily price movement is bias towards more extreme upwards movement, there is no indication that a big price move today predicts a big price move tomorrow.
What does Green and Red Mean in Candlestick Charts
Candlestick charts show green if the stock went up in a given period and red if the stock went down in a given period. The "wicks" of the candle sticks show the high and low prices during the period. The period is typically five minutes or one day.
Candlestick charts are heavily used in technical analysis to identify trading patterns in day trading. Identifying patterns in technical analysis can be very profitable, but the simple plan of buying when the candlesticks are green and selling when the candlesticks are red will not yield consistent positive returns.
Check out Tom Hamilton's analysis using technical analysis to learn more about interpreting technical chart patterns.
Guidance for Beginning Investors
For new investors, check out our new investor tips guide as well as our ultimate guide for beginning investors. Even though investing based on a stock's color is discouraged, here are some tips for new investors that will help your portfolio: