
Sound investments
don't happen alone
Find your crew, build teams, compete in VS MODE, and identify investment trends in our evergrowing investment ecosystem. You aren't on an island anymore, and our community is here to help you make informed decisions in a complex world.


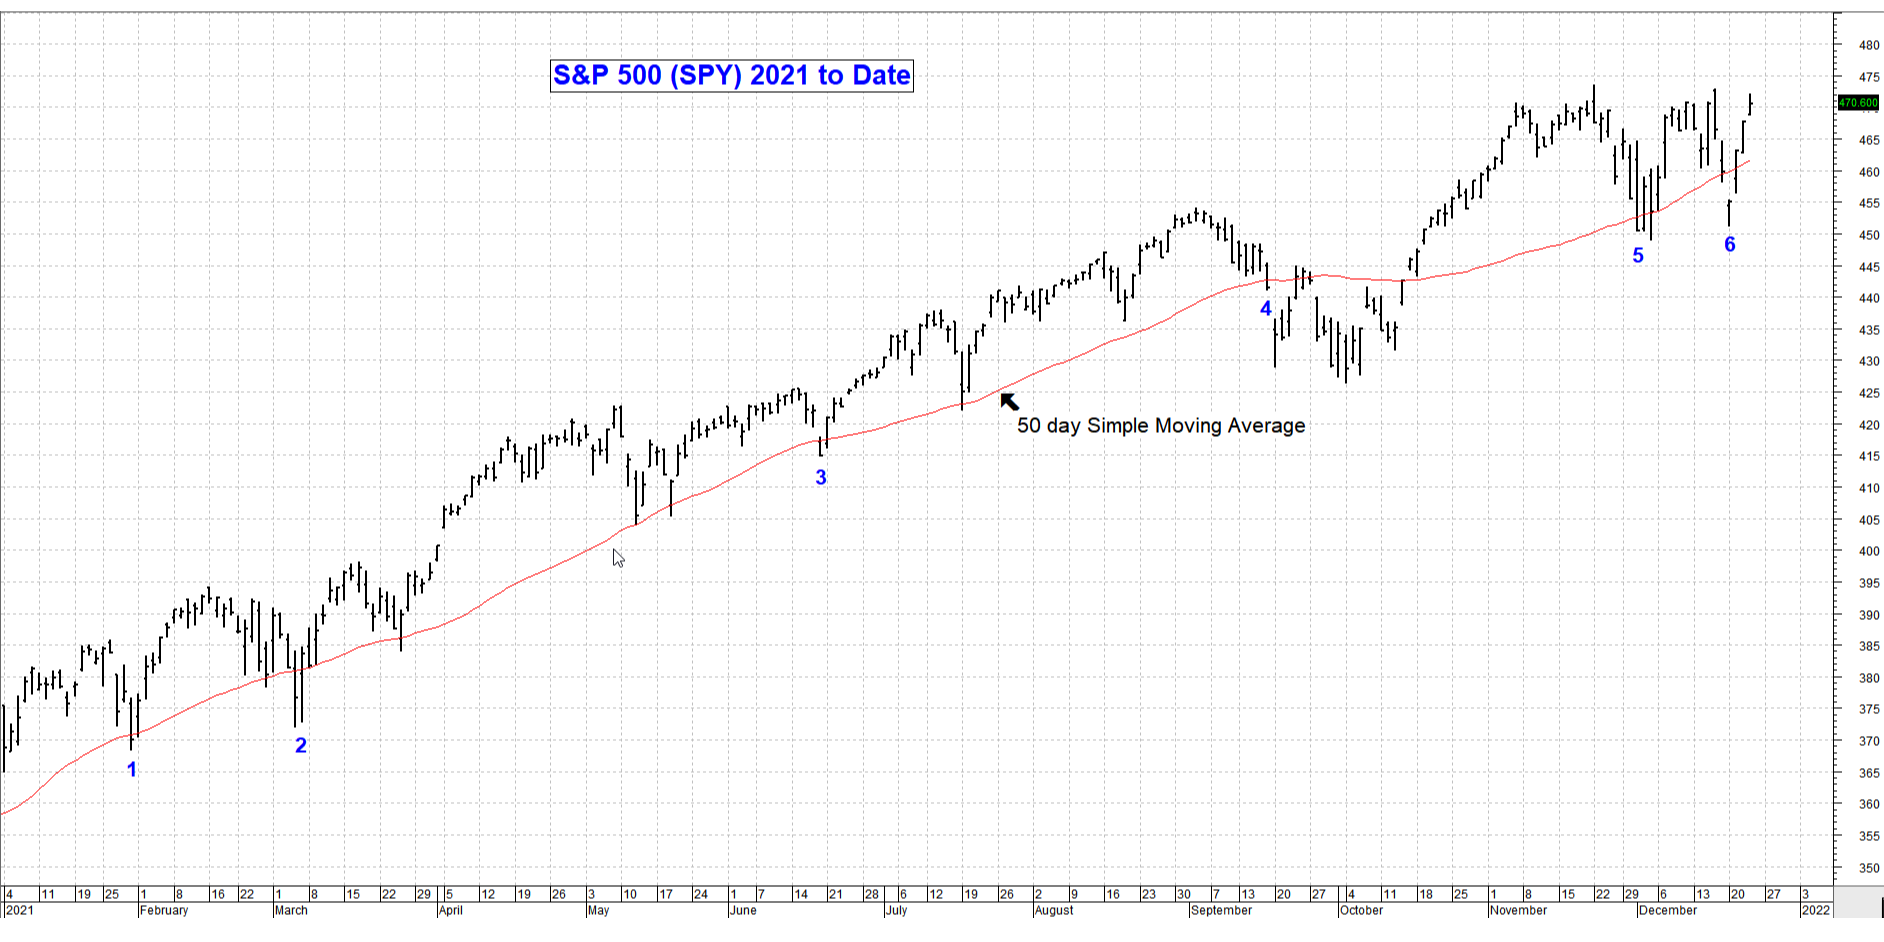
Keeping the past year in perspective, I show the S&P 500 ETF (SPY) in the chart below.
Over all it was a great year, but just take a look at the 6 “scares” that closed below the 50 day simple moving average. It was good to “buy the dips and sell the rips” but there will come a time when that will be disastrous. Thus we need to look at the overall market and not just price actions. Thus my work on a master multiple indicator to help gauge the market. BTW, nothing is totally fool prove and works all of the time, but at the hard right edge of the chart it sure helps to have something to use to confirm a position change. More explanations to come. In the meantime, enjoy the holidays and get ready for 2022. I’m thinking that next year will be more challenging than last and it’s a good idea to get prepared. Take Care. …. Tom ….