Introduction
Target Corporation (TGT) is one of the cornerstones of the American retail industry and currently is the 7th largest retailer in the US. In order to operate close to 2.000 physical stores in the US, Target has a total of over 400 thousand employees in order to run efficiently. Making them one of the largest employers in the US. So, it comes as no surprise that Target has a strong reputation with its employees and long-term investors since Target has been showing continuous growth over the years and has been trading on the stock market for decades, Target is also incorporated in the S&P500 index.
Over time, Target grew out to be a billion dollar company, ranking among the top US retailers by revenue and has shown their skills that they are able to adapt to various challenges including economic downturns, inflationary time periods as well as new innovations with technologies such as E-commerce. In this article we will take a closer look at the fundamentals and financials of Target. Explicitly, a company overview, industry overview, recent earnings, financial analysis and an investment outlook.
Company overview
Target’s business model revolves around providing customers with a various assortment of products ranging from food, clothing, household goods, electronics and more. The product strategy involves offering popular national brands as well as providing customers with their own brand and private labels. Ensuring that all the wants and needs of different customer profiles are met. Noteworthy is that 1/3 of the products that Target sells are private labels owned by Target.
Furthermore, Target’s competitive market position is thanks to its efficient supply chain facilities and strategic store locations where 75% of US citizens live within 10 miles of a physical store. Ultimately, enhancing the shopping experience and convenience of customers.
With the global adoption of E-commerce technologies, Target is finding new strategies in order to stay on top of the competition and satisfy changing customer behavior. That is why Target has expanded its digital shopping experience through initiatives such as same day deliveries, personalized shopping and saving experiences as well pickup locations for shopping done online.
Industry Overview
The retail industry is one of the largest industries in the world and where the total US retail sales account for 28.3% of the global retail sales in 2023. Furthermore, the US is also home to the largest retailers in the world. The major players in the industry are also the competitors from Target. Some of these companies are Walmart, Amazon, Costco and Kroger.
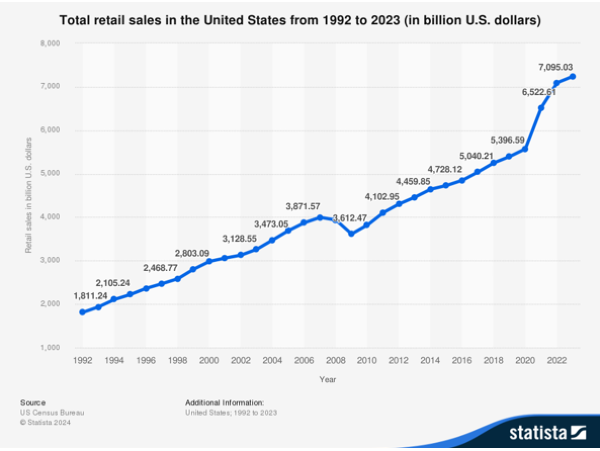
Figure 1 shows that there has been consistent growth in the total retail sales in the US over the last 30 years. Apart from 2008, during this time, the US experienced a recession and economic uncertainty following from the financial crisis. Another interesting event that occurred in this time frame was the Covid-19 pandemic in 2020. However, rather than a decline in sales the contrary happened. Total retail sales increased drastically from $5.5 trillion in 2020 to $6.5 trillion in 2021. Hence, even though the whole world was in lockdown, retail sales continued to thrive in this time period. One of the reasons this was the case is due to the fact that grocery stores remained open during the lockdown period and consumers were stocking up on certain goods and supplies, partially caused by the fear of the lockdowns. Another valid argument for the increase in retail sales was that consumers could not spend their money elsewhere since traveling, restaurants, leisure and other luxury activities were all closed.
Another major trend that got a lot of traction since the Covid-19 pandemic was the rise in E-commerce sales. Consumer behavior changed since more people started to work remotely at home as well as avoiding physical stores to shop. As a result, many people started to do their shopping online and businesses are already adapting their business strategies in order to meet online demand and remain competitive. Services that large retailers currently provide with respect to E-commerce are click and collect, pick-up locations and same day deliveries. In 2023, 15% of the total US retail sales revenue originated from E-commerce and is expected to grow with a compound annual growth rate (CAGR) of 12.7% until 2027. Significantly outperforming the growth in sales for physical stores. Furthermore, consumers are 19.2% more likely to purchase their products from companies that offer omnichannel pick up services such as pick-up sites and delivery options. Hence, E-commerce will continue to grow within the retail industry and companies are changing their business model in order to satisfy changing customer behavior.
Figure 1: Total US retail sales
Recent performance of Target (TGT), quarterly earnings Q3 2024
Target’s share price dropped 19.8% or to $121.72 respectively after releasing their Q3 earnings. Investors were disappointed since there is a lot of pressure on both sides of the income statement. While total revenue did increase by 1.1% relative to Q3 2023, it was below the expectation of 1.8%. Revenue growth was primarily driven by an increase of 10.8% in digital sales, comparable sales only grew 0.3%. Furthermore, Target showed weakness in maintaining their gross margin as it dropped from 27.4% to 27.2% in Q3 year over year. Indicating that Target is suffering from higher general & administrative expenses.
Target also showed a decrease in the earnings per share in contrast to a year ago, which was $1.85 and $2.10 in Q3 2023 respectively. A further cautious outlook for Q4 2024 was mentioned and earnings had to be adjusted to lower expectations. Ultimately, causing the stock to drop.
However, Target will continue to leverage its reputation and brand image in order to keep up with its competitors like Amazon and Walmart. Target will invest and act upon new E-commerce opportunities, delivery & pick-up locations as well as digitalizing the physical stores to enhance the customer shopping experience. Hence, Target will adapt their business model based on upcoming trends and changing consumer behavior, showcasing their capabilities to innovate and strive on the long run.
Financial analysis and key metrics
In order to get a better understanding of the financial health of Target, a closer look is taken into the development of the balance sheet, income statement as well as key performance indicators (KPIs) over the last years. Based on these metrics, it is possible to gain insights regarding the performance and determine whether Target is likely to stay on top of its competition and grow over time.
Balance sheet development
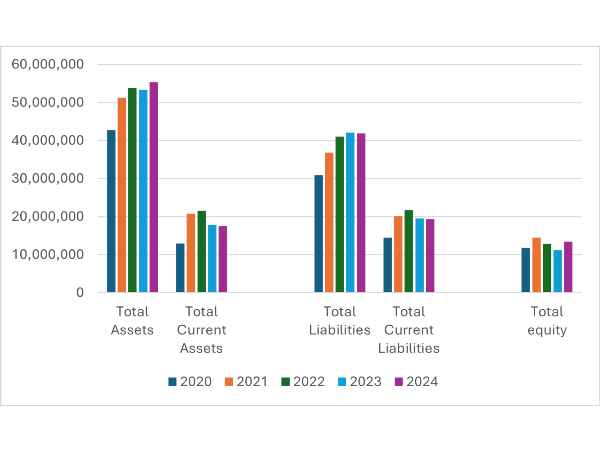
Starting off with the balance sheet development as shown in Figure 2 from 2020 to 2024. First, the total assets showed steady growth over time, indicating that Target is continuing to expand their business by opening new physical stores as well as investing more in their E-commerce strategy. Ultimately, enhancing revenue growth. Noteworthy is that the growth in total assets came from both an increase in property, plant equipment (PPE) and an increase in total current assets.
With respect to the total current assets, while Target’s goal is to keep the current assets stable to ensure meeting short term obligations, there was a significant increase in the total current assets in 2021 and 2022. This increase was primarily driven by the increase in cash and cash equivalents as well as an increase in inventory levels. After 2023, the total current assets decreased again due to a lower amount of cash and cash equivalents on the balance sheet. Hence, keeping current assets stable shows that Target is able to meet their short term obligations and implement efficient inventory management.
Continuing with the total liabilities which have grown in the first 2 years but stayed relatively stable after 2022. This is in line with the growth of the total assets since Target continued to invest in the expansion of the business. Hence, Target now has more long-term debt in order to finance new stores and other technological innovations. Turning over to the total current liabilities, the growth in current liabilities shows a similar pattern as the growth in current assets. Specifically, in 2021 and 2022, the current liabilities increased primarily due to an increase in the total account payable. Current liabilities did decrease again in 2023 and after. However, in order to determine whether Target is efficiently managing their short term debt, it is important to look into the current and quick ratio which will be discussed later on in the article.
Finally, total equity remained relatively the same, ranging around $12.7 billion throughout the years. Implying that Target takes care of their investors and prevents dilution of shareholder value by not financing new projects with equity but rather with debt. Furthermore, while almost 50% of the net income is distributed back to shareholders in the form of dividends, Target further uses their retained earnings to reinvest and expand their business.
Figure 2: Progress balance sheet
Income statement development
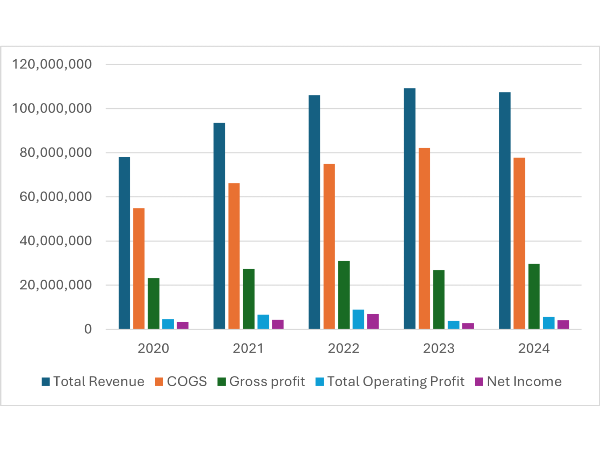
Moving over to the income statement of Target. The first thing that pops up in figure 3 is the increase in total revenue from 2020 to 2023 and the stagnation in 2024. The Increase in revenue over time reflects Target’s managerial skills to adapt their business model based on changing customer behavior as well as current and future market conditions. Some of the challenges that Target had to face in the last 4 years were the Covid-19 pandemic, high inflation and higher interest rates. One reason for the stabilization of the revenue in 2024 is lower consumer expenditures due to inflation and customers moving to competitors.
Next, the increase in cost of goods sold (COGS) is linear to the increase in revenue apart from 2023 where COGS increased more relative to the revenue. As a result, Target suffered from extra pressure on their gross margins caused by supply chain issues and rising costs due to inflation. In 2024, the COGS decreased showcasing a better economic environment and better control of cost management.
Furthermore, the gross margin remained very stable from 2020 to 2022. Specifically, the gross margin was around 29% but decreased in 2023 to 24.6% indicating there is margin pressures caused by the increase of cost of goods sold. While the gross margin did increase again to 27.6% in 2024, it is still below their ideal rate of 29%. Hence, Target is struggling to maintain their gross profit margin because they cannot translate the higher costs into the price of their products as this would decrease demand.
Finally, Net income remains volatile throughout the years. Ranging between 2.55% and 6.55%. Net profit margins and total net profit increased from 2020 to 2022 but showed a steep decline in 2023 where the profit margin equaled 2.55% or only $2.78 billion. While there is a small recovery in 2024 with a net profit margin of 3.85% or $4.1 billion total net profits, it remains below the margins of 2022 and before. The main reason for the decrease in the last 2 years is due to the increase in operating expenses such as selling, general and administrative expense.
Figure 3: income statement progression
Key metrics
For the final part of the financial analysis, a closer look is taken into the key metrics of Target. These ratios will help us gain more insights into the financial wellbeing of the company.
All key ratios are mentioned in the table below. The profitability margins such as the gross and net profit margin have already been discussed above at the income statement section. But to summarize, in the last 2 years Target is facing additional challenges such as inflation, supply chain issues and changing customer behavior and as a result, these challenges put downward pressure on the profitability of Target. There is a small recovery in 2024 in comparison to 2023, indicating that Target is improving with respect to their cost management and pricing strategies. Furthermore, the return on assets (ROA) measures how efficient Target is in generating revenue thanks to their assets. While the ROA was very strong and increasing from 2020 to 2022 thanks to the increase in net income, the opposite occurred in 2023 and 2024. Net income dropped while total assets remained relatively the same. Hence, the loss in net income caused the ROA to drop in 2023 and 2024 as well.
Continuing with the valuation ratios, the price to earnings ratio (P/E) measures the price per share relative to the earnings per share. The P/E ratio ranges from 16.9 to 23.55 with a current P/E ratio of 17.74 in 2024. The decrease in comparison to 2023 is likely due to a poor outlook of Target and lower investor confidence in the stock. However, the average P/E industry ratio is 25, indicating that Target might be undervalued compared to its competitors and industry average. In contrast the price to book ratio (P/B) measures the price of Target relative to the book value of the company. The rise from 2020 to 2022 shows market optimism from investors regarding sales growth in the future. However, the decline in 2023 and 2024 might be caused by adjusted valuations of analysts due to lower than expected sales growth.
For the liquidity ratios, the current and quick ratio are taken into account. The current ratios measure the current assets over current liabilities. The quick ratio does the same but does not incorporate inventory as this is seen as an illiquid current asset. The current ratio remained relatively stable over time, ranging between 0.90 and 1.03. While the ratio is just below 1 now, Target is still able to meet its short-term liabilities. However, when we look at the quick ratio and therefore remove the inventory levels, we see that the ratio drops significantly. A low ratio implies that Target is very dependent on selling their inventory in order to meet its current liabilities.
Finally, efficiency ratios such as the inventory turnover measures how many times Target sells its inventory during a specific period. The turnover has ranged between 5.71 and 6.64 over the last 5 years and currently sits at 5.94. Indicating that the inventory is sold a bit slower in comparison to a few years ago. However, since it is quite consistent, Target does a decent job of managing their inventories. Next, the days in inventory tells us something more about how many days it takes for Target to sell its inventory. A lower number is recommended as it signals that it is easier for the company to sell their inventory. With respect to Target, the days in inventory improved from 2023 to 2024, going from 66.5 to 61.4 days. Meaning that it now only takes 61.4 days to clear sell their inventory. Hence, showcasing the strong inventory management skills of Target and their ability to work with excess stock from prior years.
| Ratio |
2020 |
2021 |
|
2022 |
2023 |
2024 |
| Gross Margin |
29.76% |
29.27% |
|
29.28% |
24.64% |
27.63% |
| Net Profit Margin |
4.19% |
4.67% |
|
6.55% |
2.55% |
3.85% |
| ROA |
7.78% |
9.20% |
|
13.29% |
5.22% |
7.66% |
| P/E |
17.75 |
21.44 |
|
16.92 |
23.55 |
17.74 |
| P/B |
4.90 |
6.81 |
|
7.86 |
7.19 |
5.13 |
| Current Ratio |
0.89 |
1.03 |
|
0.99 |
0.92 |
0.91 |
| Quick Ratio |
0.24 |
0.48 |
|
0.33 |
0.20 |
0.27 |
| Inventory Turnover |
5.71 |
6.64 |
|
6.11 |
5.49 |
5.94 |
| Days in Inventory |
63.96 |
54.95 |
|
59.71 |
66.51 |
61.43 |
Conclusion
Target has proven its ability to remain competitive in the last decade by quickly adapting their business model based on future economic market trends. It further enhanced its reputation by diversifying its product offerings, leveraging private-label brands as well as adopting innovative strategies to meet shifting consumer behavior.
While the financial analysis highlights strong revenue growth from 2020 to 2023, recent challenges such as inflation, supply chain issues, and increased competition have strained margins and profitability. However, Target's focus on expanding its e-commerce capabilities and improving the customer shopping experience signals its commitment to long-term growth. Furthermore, the balance sheet reflects a stable financial position, with steady asset growth and careful management of both equity and liabilities. Key metrics such as the gross margin, net profit margin and inventory turnover indicate that Target is gaining traction again following from the lows in 2023. Hence, showing improvement in 2024.
Investment outlook
Looking into the future, Target is committed to expanding their E-commerce sales by implementing new technologies and innovations such as omnichannel pickup services, digital shopping experiences, same day deliveries and more. Ultimately, enhancing the customers experience and meeting all the wants and needs from various customer profiles. Furthermore, Target’s ability to adapt to changing market conditions, coupled with a focus on inventory management, positions the company well for continued competitiveness.
For investors, Target offers a balance of growth potential and stable dividend payouts, making it an attractive choice for those seeking a combination of passive income as well as long-term capital gains. The stock appears undervalued compared to the average P/E ratio of the retail industry, presenting an opportunity for value-oriented investors. Nonetheless, risk factors such as economic uncertainty and intense competition should be carefully considered.
I/we have no positions in any asset mentioned, but may initiate a position over the next 7 days







Introduction
Target Corporation (TGT) is one of the cornerstones of the American retail industry and currently is the 7th largest retailer in the US. In order to operate close to 2.000 physical stores in the US, Target has a total of over 400 thousand employees in order to run efficiently. Making them one of the largest employers in the US. So, it comes as no surprise that Target has a strong reputation with its employees and long-term investors since Target has been showing continuous growth over the years and has been trading on the stock market for decades, Target is also incorporated in the S&P500 index.
Over time, Target grew out to be a billion dollar company, ranking among the top US retailers by revenue and has shown their skills that they are able to adapt to various challenges including economic downturns, inflationary time periods as well as new innovations with technologies such as E-commerce. In this article we will take a closer look at the fundamentals and financials of Target. Explicitly, a company overview, industry overview, recent earnings, financial analysis and an investment outlook.
Company overview
Target’s business model revolves around providing customers with a various assortment of products ranging from food, clothing, household goods, electronics and more. The product strategy involves offering popular national brands as well as providing customers with their own brand and private labels. Ensuring that all the wants and needs of different customer profiles are met. Noteworthy is that 1/3 of the products that Target sells are private labels owned by Target.
Furthermore, Target’s competitive market position is thanks to its efficient supply chain facilities and strategic store locations where 75% of US citizens live within 10 miles of a physical store. Ultimately, enhancing the shopping experience and convenience of customers.
With the global adoption of E-commerce technologies, Target is finding new strategies in order to stay on top of the competition and satisfy changing customer behavior. That is why Target has expanded its digital shopping experience through initiatives such as same day deliveries, personalized shopping and saving experiences as well pickup locations for shopping done online.
Industry Overview
The retail industry is one of the largest industries in the world and where the total US retail sales account for 28.3% of the global retail sales in 2023. Furthermore, the US is also home to the largest retailers in the world. The major players in the industry are also the competitors from Target. Some of these companies are Walmart, Amazon, Costco and Kroger.
Figure 1 shows that there has been consistent growth in the total retail sales in the US over the last 30 years. Apart from 2008, during this time, the US experienced a recession and economic uncertainty following from the financial crisis. Another interesting event that occurred in this time frame was the Covid-19 pandemic in 2020. However, rather than a decline in sales the contrary happened. Total retail sales increased drastically from $5.5 trillion in 2020 to $6.5 trillion in 2021. Hence, even though the whole world was in lockdown, retail sales continued to thrive in this time period. One of the reasons this was the case is due to the fact that grocery stores remained open during the lockdown period and consumers were stocking up on certain goods and supplies, partially caused by the fear of the lockdowns. Another valid argument for the increase in retail sales was that consumers could not spend their money elsewhere since traveling, restaurants, leisure and other luxury activities were all closed.
Another major trend that got a lot of traction since the Covid-19 pandemic was the rise in E-commerce sales. Consumer behavior changed since more people started to work remotely at home as well as avoiding physical stores to shop. As a result, many people started to do their shopping online and businesses are already adapting their business strategies in order to meet online demand and remain competitive. Services that large retailers currently provide with respect to E-commerce are click and collect, pick-up locations and same day deliveries. In 2023, 15% of the total US retail sales revenue originated from E-commerce and is expected to grow with a compound annual growth rate (CAGR) of 12.7% until 2027. Significantly outperforming the growth in sales for physical stores. Furthermore, consumers are 19.2% more likely to purchase their products from companies that offer omnichannel pick up services such as pick-up sites and delivery options. Hence, E-commerce will continue to grow within the retail industry and companies are changing their business model in order to satisfy changing customer behavior.
Figure 1: Total US retail sales
Recent performance of Target (TGT), quarterly earnings Q3 2024
Target’s share price dropped 19.8% or to $121.72 respectively after releasing their Q3 earnings. Investors were disappointed since there is a lot of pressure on both sides of the income statement. While total revenue did increase by 1.1% relative to Q3 2023, it was below the expectation of 1.8%. Revenue growth was primarily driven by an increase of 10.8% in digital sales, comparable sales only grew 0.3%. Furthermore, Target showed weakness in maintaining their gross margin as it dropped from 27.4% to 27.2% in Q3 year over year. Indicating that Target is suffering from higher general & administrative expenses.
Target also showed a decrease in the earnings per share in contrast to a year ago, which was $1.85 and $2.10 in Q3 2023 respectively. A further cautious outlook for Q4 2024 was mentioned and earnings had to be adjusted to lower expectations. Ultimately, causing the stock to drop.
However, Target will continue to leverage its reputation and brand image in order to keep up with its competitors like Amazon and Walmart. Target will invest and act upon new E-commerce opportunities, delivery & pick-up locations as well as digitalizing the physical stores to enhance the customer shopping experience. Hence, Target will adapt their business model based on upcoming trends and changing consumer behavior, showcasing their capabilities to innovate and strive on the long run.
Financial analysis and key metrics
In order to get a better understanding of the financial health of Target, a closer look is taken into the development of the balance sheet, income statement as well as key performance indicators (KPIs) over the last years. Based on these metrics, it is possible to gain insights regarding the performance and determine whether Target is likely to stay on top of its competition and grow over time.
Balance sheet development
Starting off with the balance sheet development as shown in Figure 2 from 2020 to 2024. First, the total assets showed steady growth over time, indicating that Target is continuing to expand their business by opening new physical stores as well as investing more in their E-commerce strategy. Ultimately, enhancing revenue growth. Noteworthy is that the growth in total assets came from both an increase in property, plant equipment (PPE) and an increase in total current assets.
With respect to the total current assets, while Target’s goal is to keep the current assets stable to ensure meeting short term obligations, there was a significant increase in the total current assets in 2021 and 2022. This increase was primarily driven by the increase in cash and cash equivalents as well as an increase in inventory levels. After 2023, the total current assets decreased again due to a lower amount of cash and cash equivalents on the balance sheet. Hence, keeping current assets stable shows that Target is able to meet their short term obligations and implement efficient inventory management.
Continuing with the total liabilities which have grown in the first 2 years but stayed relatively stable after 2022. This is in line with the growth of the total assets since Target continued to invest in the expansion of the business. Hence, Target now has more long-term debt in order to finance new stores and other technological innovations. Turning over to the total current liabilities, the growth in current liabilities shows a similar pattern as the growth in current assets. Specifically, in 2021 and 2022, the current liabilities increased primarily due to an increase in the total account payable. Current liabilities did decrease again in 2023 and after. However, in order to determine whether Target is efficiently managing their short term debt, it is important to look into the current and quick ratio which will be discussed later on in the article.
Finally, total equity remained relatively the same, ranging around $12.7 billion throughout the years. Implying that Target takes care of their investors and prevents dilution of shareholder value by not financing new projects with equity but rather with debt. Furthermore, while almost 50% of the net income is distributed back to shareholders in the form of dividends, Target further uses their retained earnings to reinvest and expand their business.
Figure 2: Progress balance sheet
Income statement development
Moving over to the income statement of Target. The first thing that pops up in figure 3 is the increase in total revenue from 2020 to 2023 and the stagnation in 2024. The Increase in revenue over time reflects Target’s managerial skills to adapt their business model based on changing customer behavior as well as current and future market conditions. Some of the challenges that Target had to face in the last 4 years were the Covid-19 pandemic, high inflation and higher interest rates. One reason for the stabilization of the revenue in 2024 is lower consumer expenditures due to inflation and customers moving to competitors.
Next, the increase in cost of goods sold (COGS) is linear to the increase in revenue apart from 2023 where COGS increased more relative to the revenue. As a result, Target suffered from extra pressure on their gross margins caused by supply chain issues and rising costs due to inflation. In 2024, the COGS decreased showcasing a better economic environment and better control of cost management.
Furthermore, the gross margin remained very stable from 2020 to 2022. Specifically, the gross margin was around 29% but decreased in 2023 to 24.6% indicating there is margin pressures caused by the increase of cost of goods sold. While the gross margin did increase again to 27.6% in 2024, it is still below their ideal rate of 29%. Hence, Target is struggling to maintain their gross profit margin because they cannot translate the higher costs into the price of their products as this would decrease demand.
Finally, Net income remains volatile throughout the years. Ranging between 2.55% and 6.55%. Net profit margins and total net profit increased from 2020 to 2022 but showed a steep decline in 2023 where the profit margin equaled 2.55% or only $2.78 billion. While there is a small recovery in 2024 with a net profit margin of 3.85% or $4.1 billion total net profits, it remains below the margins of 2022 and before. The main reason for the decrease in the last 2 years is due to the increase in operating expenses such as selling, general and administrative expense.
Figure 3: income statement progression
Key metrics
For the final part of the financial analysis, a closer look is taken into the key metrics of Target. These ratios will help us gain more insights into the financial wellbeing of the company.
All key ratios are mentioned in the table below. The profitability margins such as the gross and net profit margin have already been discussed above at the income statement section. But to summarize, in the last 2 years Target is facing additional challenges such as inflation, supply chain issues and changing customer behavior and as a result, these challenges put downward pressure on the profitability of Target. There is a small recovery in 2024 in comparison to 2023, indicating that Target is improving with respect to their cost management and pricing strategies. Furthermore, the return on assets (ROA) measures how efficient Target is in generating revenue thanks to their assets. While the ROA was very strong and increasing from 2020 to 2022 thanks to the increase in net income, the opposite occurred in 2023 and 2024. Net income dropped while total assets remained relatively the same. Hence, the loss in net income caused the ROA to drop in 2023 and 2024 as well.
Continuing with the valuation ratios, the price to earnings ratio (P/E) measures the price per share relative to the earnings per share. The P/E ratio ranges from 16.9 to 23.55 with a current P/E ratio of 17.74 in 2024. The decrease in comparison to 2023 is likely due to a poor outlook of Target and lower investor confidence in the stock. However, the average P/E industry ratio is 25, indicating that Target might be undervalued compared to its competitors and industry average. In contrast the price to book ratio (P/B) measures the price of Target relative to the book value of the company. The rise from 2020 to 2022 shows market optimism from investors regarding sales growth in the future. However, the decline in 2023 and 2024 might be caused by adjusted valuations of analysts due to lower than expected sales growth.
For the liquidity ratios, the current and quick ratio are taken into account. The current ratios measure the current assets over current liabilities. The quick ratio does the same but does not incorporate inventory as this is seen as an illiquid current asset. The current ratio remained relatively stable over time, ranging between 0.90 and 1.03. While the ratio is just below 1 now, Target is still able to meet its short-term liabilities. However, when we look at the quick ratio and therefore remove the inventory levels, we see that the ratio drops significantly. A low ratio implies that Target is very dependent on selling their inventory in order to meet its current liabilities.
Finally, efficiency ratios such as the inventory turnover measures how many times Target sells its inventory during a specific period. The turnover has ranged between 5.71 and 6.64 over the last 5 years and currently sits at 5.94. Indicating that the inventory is sold a bit slower in comparison to a few years ago. However, since it is quite consistent, Target does a decent job of managing their inventories. Next, the days in inventory tells us something more about how many days it takes for Target to sell its inventory. A lower number is recommended as it signals that it is easier for the company to sell their inventory. With respect to Target, the days in inventory improved from 2023 to 2024, going from 66.5 to 61.4 days. Meaning that it now only takes 61.4 days to clear sell their inventory. Hence, showcasing the strong inventory management skills of Target and their ability to work with excess stock from prior years.
Conclusion
Target has proven its ability to remain competitive in the last decade by quickly adapting their business model based on future economic market trends. It further enhanced its reputation by diversifying its product offerings, leveraging private-label brands as well as adopting innovative strategies to meet shifting consumer behavior.
While the financial analysis highlights strong revenue growth from 2020 to 2023, recent challenges such as inflation, supply chain issues, and increased competition have strained margins and profitability. However, Target's focus on expanding its e-commerce capabilities and improving the customer shopping experience signals its commitment to long-term growth. Furthermore, the balance sheet reflects a stable financial position, with steady asset growth and careful management of both equity and liabilities. Key metrics such as the gross margin, net profit margin and inventory turnover indicate that Target is gaining traction again following from the lows in 2023. Hence, showing improvement in 2024.
Investment outlook
Looking into the future, Target is committed to expanding their E-commerce sales by implementing new technologies and innovations such as omnichannel pickup services, digital shopping experiences, same day deliveries and more. Ultimately, enhancing the customers experience and meeting all the wants and needs from various customer profiles. Furthermore, Target’s ability to adapt to changing market conditions, coupled with a focus on inventory management, positions the company well for continued competitiveness.
For investors, Target offers a balance of growth potential and stable dividend payouts, making it an attractive choice for those seeking a combination of passive income as well as long-term capital gains. The stock appears undervalued compared to the average P/E ratio of the retail industry, presenting an opportunity for value-oriented investors. Nonetheless, risk factors such as economic uncertainty and intense competition should be carefully considered.
I/we have no positions in any asset mentioned, but may initiate a position over the next 7 days