Sound investments
don't happen alone
Find your crew, build teams, compete in VS MODE, and identify investment trends in our evergrowing investment ecosystem. You aren't on an island anymore, and our community is here to help you make informed decisions in a complex world.









January 13, 2023 -
Time to revisit “The Big Picture”. Right now investors are caught between being optimistic and pessimistic. Let’s review.
Optimistic / Bullish –
Pessimistic / Bearish –
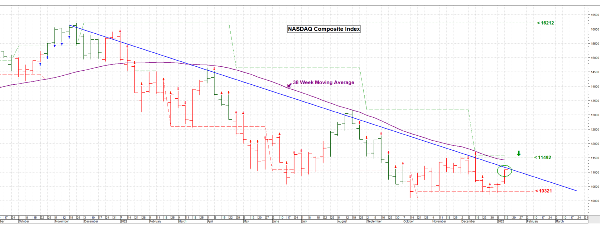
Let’s look at the weekly chart of the broad NASDAQ Composite for some clues.
Three Bullish Things to Watch- What I’m showing is a downward sloping trending line (blue) draw from the market high and touching recent swing peaks. Two consecutive weekly closes above that line would be Bullish. That’s one. Then I draw a 38 week simple moving average (purple). Again, having two consecutive weeks closing above it is Bullish. That’s two. Lastly, we need a weekly close about a resistance level (green arrow). That Level currently is 11492 and would indicate a breakout; if it’s on high volume that would confirm. That’s three.
Right now all I can say is that we’re still in a wide trading range and hopefully building a base to launch a move higher. But . . . that could all change, see the Pessimistic items above. For the time being I’m seeing strength in the rest of the world. Specifically select European and Asian countries. I’m “dipping my toe in” with small positions there.
I don’t expect this market to turn on a dime, but once a breakout does come (not yet) we’ll know that by wide up bars on heavy volume day after day, then minor pull backs on light volume. That’s it for now. Have a good week. ……….. Tom ………….
Price chart by MetaStock; table by www.HighGrowthStock.com. Used with permission. More information at: www.special-risk.net