The Top Utility ETFs for Income Investors
1). iShares Global Utilities ETF (JXI)
2). Tied for second: Utilities Select Sector SPDR Fund (XLU)
2). Tied for second: Vanguard Utilities Index Fund (VPU)
2). Tied for second: Virtus Reaves Utilities ETF (UTES)
3). Fidelity MSCI Utilities Index ETF (FUTY)
4). Invesco S&P SmallCap Utilities & Communication Services ETF (PSCU)
5). Vanguard Utilities Index Fund Admiral Shs (VUIAX)
6). iShares U.S. Utilities ETF (IDU)
7). First Trust Utilities AlphaDEX Fund (FXU)
8). Invesco S&P 500 Equal Weight Utilities ETF (RYU)
9). Invesco DWA Utilities Momentum ETF (PUI)
10). Global X Renewable Energy Producers ETF (RNRG)
1). iShares Global Utilities ETF (JXI)
- APR: 3.40%
- Standard Deviation: 1.26%
- Max Drawdown: -34.20%
- Yield: 3.22%
- Expense Ratio: 0.40%

JXI is our pick as the top utility ETF for income investors. The ETF tracks the S&P Global 1200 utilities sector and is a capped index. With the capped index, no holding can be more than 10% of the fund with all holdings market-cap weighted.
The JXI is our top pick due to its low volatility, drawdown, and yield. As of November, 2022, JXI had the highest yield and the lowest 5-year volatility versus its counterparts. Its expense ratio is higher than its peers, but it makes up for it with less volatility and consistent annual returns.
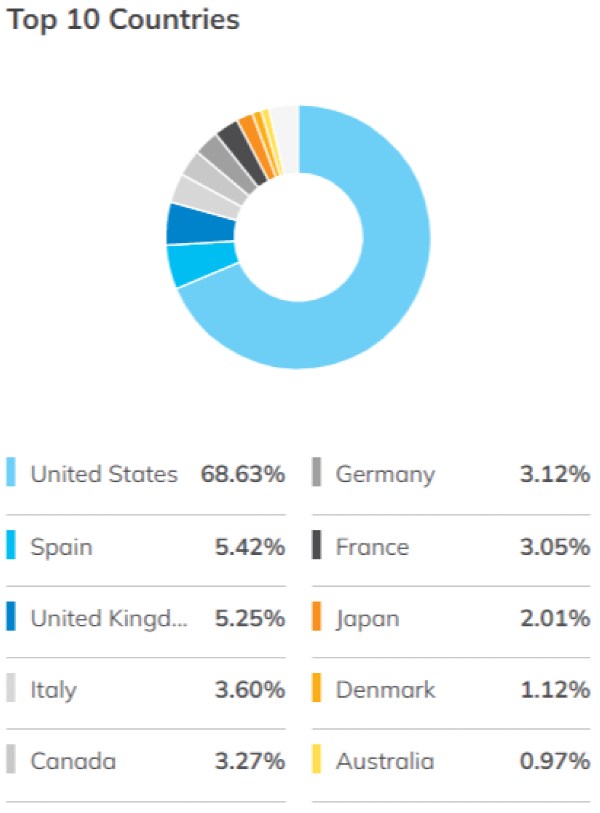
JXI likely reached the top of our list due to its index expanding beyond the United States. The ETF is mostly in the United States, followed by Europe, Canada, Japan and Australia.
One concern about JXI is that its governance allows it to invest up to 20% of its assets in futures, options, swap contracts, cash and cash equivalents. That is quite high even if the derivatives are synthetic representations of the index. That means up to 20% of the fund may not be invested in assets that will yield dividend income for the investor. However, as of the writing of this article, JXI has over 99% of their assets invested in utilities while only 0.18% is invested in cash and/or derivatives.
2). The Tie for Second: XLU, VPU, and UTES

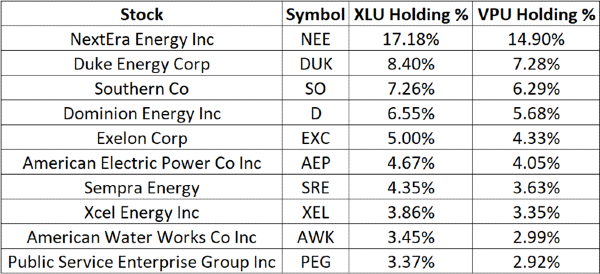
Basically, from an investment standpoint, XLU and VPU are the same ETF. They have the same expense ratio, the same volatility, the same 5-year stock performance, and the same yield. And of course this is the case. Even though they track different indices, they have the exact same top 10 holdings, in the exact same order of assets held. Now, each asset is held at different percentage of the portfolio, but these are such insignificant differences that its no wonder the ETFs are practically the same.
The Virtus Reaves utilities ETF (UTES) is a different consideration. UTES is the top ETF on this list in terms of APR and ranks well for volatility. Where UTES is by having a high expense ratio and a low yield. UTES is an actively managed ETF so its been able to hedge against the recent downturn in the stock market. This downturn has affected utilities even as they’ve been used as a hedge in the market, to see this phenomenon, read our article, Southern Company – A Buy but Not Without Risk. In the article, we can watch as Southern Company is used as a hedge, until the overall market falls below resistance lines.
UTES is an ETF to consider as an actively managed alternative to XLU and VPU. While you have to pay a higher expense ratio you get a managed fund that has proven it can return a higher APR while keeping volatility low. Even though it is tied with VPU and XLU, if I had to choose, I would choose APR and volatility management over yield and expense ratio in this particular case. The higher expense ratio doesn’t offset the higher performance UTES has returned to its investors.
Utilities Select Sector SPDR Fund (XLU)
- APR: 5.28%
- Standard Deviation: 1.42%
- Max Drawdown: 36.70%
- Yield: 3.04%
- Expense Ratio: 0.10%
Vanguard Utilities Index Fund (VPU)
- APR: 5.11%
- Standard Deviation: 1.41%
- Max Drawdown: 36.82%
- Yield: 3.05%
- Expense Ratio: 0.10%
Virtus Reaves Utilities ETF (UTES)
- APR: 7.31%
- Standard Deviation: 1.34%
- Max Drawdown: 35.71%
- Yield: 2.16%
- Expense Ratio: 0.49%
3). Fidelity MSCI Utilities Index ETF (FUTY)
- APR: 5.22%
- Standard Deviation: 1.41%
- Max Drawdown: 37.07%
- Yield: 2.88%
- Expense Ratio: 0.08%
For all intents and purposes, FUTY is nearly interchangeable with XLU and VPU. It does have the lowest expense ratio of all the ETFs on this list, but its average in terms of the other parameters.
The top 8 holdings of FUTY match XLU and VPU exactly
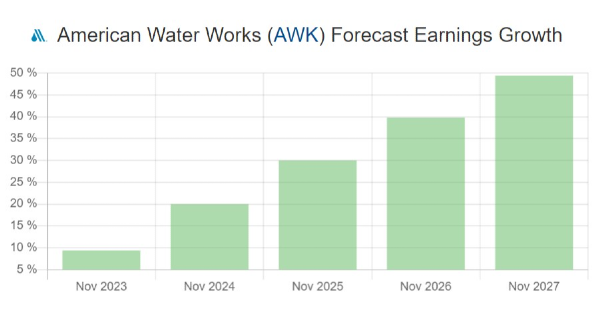
FUTY has nearly the same top 10 holdings as XLU and VPU. The only difference is that FUTY has WEC Energy Group Inc (WEC) in its top 10 while XLU and VPU have American Water Works (AWK).
From a retail investor’s perspective, investing in FUTY, XLU, or VPU are basically the same investment.
4). Invesco S&P SmallCap Utilities & Communication Services ETF (PSCU)
- APR: 0.30%
- Standard Deviation: 1.37%
- Max Drawdown: 30.36%
- Yield: 2.65%
- Expense Ratio: 0.29%
TL;DR: PSCU is an ETF for sector rotation investors, not utility investors or income investors
Unfortunately, even though PSCU made it as #4 on our list, it really is not the ETF for utility investors. Two stocks in its top 10 holdings include AMC Networks Inc (AMCX) and Shenandoah Telecommunications Co (SHEN). These holdings create a distinctly different investment profile for PSCU which stands out against the other typical Utility ETFs. While its drawdown is surprisingly low (likely due to a diversification into another sector), its 5-year APR is stagnant at 0.30%. Again, this is due to the spread of investments its investing in.
While there is nothing wrong with PSCU as an investment, PSCU should not be used as a utility ETF investment.
5). iShares U.S. Utilities ETF (IDU)
- APR: 4.89%
- Standard Deviation: 1.39%
- Max Drawdown: 36.18%
- Yield: 2.41%
- Expense Ratio: 0.39%
IDU is a similar investment to XLU, VPU and FUTY
Long story short, you can get a better investment with XLU and VPU with a lower expense ratio. Except for Waste Management (WM), IDU has basically the same top 10 stocks as XLU and VPU. Waste Management is an understandable choice, but its typically considered an industrial stock.
For income, dividend, and utility investors, you’ll get an overall better investment with our other top options.
6). First Trust Utilities AlphaDEX Fund (FXU)
- APR: 4.90%
- Standard Deviation: 1.35
- Max Drawdown: 34.81%
- Yield: 1.98%
- Expense Ratio: 0.64
FXU is a equal weighted index. This gives it more exposure to mid-cap and small-cap utilities.
FXU is not interchangeable with XLU, VPU, and FUTY. This ETF has a specific use
FXU (and our next ETF, RYU) is for investors looking for higher long-term gains and are okay going through more turbulence. FXU and RYU is not for retirement accounts, wealth preservation strategies, or pure income strategies.
7). Invesco S&P 500 Equal Weight Utilities ETF (RYU)
- APR: 6.20%
- Standard Deviation: 1.42%
- Max Drawdown: 37.43%
- Yield: 2.43%
- Expense Ratio: 0.40%
RYU does exactly what it’s meant to do as an investment. RYU is an equal weight ETF; this means it has more exposure to small-cap and mid-cap stocks. This increases the APR of the ETF, but also increases the volatility of the ETF.
RYU has one of the highest APRs on this list, but also is one of the lowest in terms of volatility metrics.
RYU is not interchangeable with XLU, VPU, and FUTY. This ETF has a specific use
Invesco DWA Utilities Momentum ETF (PUI)
- APR: 4.08%
- Standard Deviation: 1.42%
- Max Drawdown: 36.00%
- Yield: 2.11%
- Expense Ratio: 0.60%

So in theory, a utility investment like this should have a very specific profile. Its APR should be high, its standard deviation should be high (which is fine in a momentum strategy), but its drawdown should be lower. The fund should be able to minimize drawdowns by detecting momentum changes in its procedure. Its max drawdown, though slightly better, is only minimally better than standard utility ETFs VPU and XLU.
PUI is not performing as a momentum ETF, and hence isn’t worth the time or high expense ratio.
How we measure the Best Utility ETFs
Drawdown
Drawdown is the worse-case loss a stock feel during a given time interval. In this analysis we looked back 5 years. Check out our article on the safest utility stocks to invest in to learn more about drawdown.
Standard Deviation
Our analysis looks back at 5 years of daily stock changes (this is roughly 242 trading days a year). We take the standard deviation of those daily changes. Learn more about standard deviation in our article on the safest utility stocks to invest in.
Performance
For our analysis, we measured the annual rate of return of the ETF over the last five years.
Yield
Any dividends made by the ETF are passed through to the investor. This is the latest yield of the ETF. The yield will change based on the basket of stocks and instruments the ETF is composed of. ETFs that use derivatives to represent the index they follow may not receive dividends, lessening yield.
Expense Ratio
An expense ratio is the cost of running the fund as a percentage of total assets. Actively managed ETFs will typically require a higher expense ratio. The lower the expense ratio, the less you have to pay administrators and portfolio managers to have a basket of utility stocks.
Notes
Some exchange traded funds were not included in the list due to their high exposure to swaps and other derivative instruments. These ETFs include:
- ProShares Ultra Utilities (UPW)
- ProShares UltraShort Utilities (SDP)
- Global X Renewable Energy Producers ETF (RNRG)
Further Readings - Stock Ideas
Further Readings - A Guide to Investing in Utilities


The Top Utility ETFs for Income Investors
1). iShares Global Utilities ETF (JXI)
2). Tied for second: Utilities Select Sector SPDR Fund (XLU)
2). Tied for second: Vanguard Utilities Index Fund (VPU)
2). Tied for second: Virtus Reaves Utilities ETF (UTES)
3). Fidelity MSCI Utilities Index ETF (FUTY)
4). Invesco S&P SmallCap Utilities & Communication Services ETF (PSCU)
5). Vanguard Utilities Index Fund Admiral Shs (VUIAX)
6). iShares U.S. Utilities ETF (IDU)
7). First Trust Utilities AlphaDEX Fund (FXU)
8). Invesco S&P 500 Equal Weight Utilities ETF (RYU)
9). Invesco DWA Utilities Momentum ETF (PUI)
10). Global X Renewable Energy Producers ETF (RNRG)
1). iShares Global Utilities ETF (JXI)
Image by WikiImages from Pixabay
JXI is our pick as the top utility ETF for income investors. The ETF tracks the S&P Global 1200 utilities sector and is a capped index. With the capped index, no holding can be more than 10% of the fund with all holdings market-cap weighted. The JXI is our top pick due to its low volatility, drawdown, and yield. As of November, 2022, JXI had the highest yield and the lowest 5-year volatility versus its counterparts. Its expense ratio is higher than its peers, but it makes up for it with less volatility and consistent annual returns. JXI likely reached the top of our list due to its index expanding beyond the United States. The ETF is mostly in the United States, followed by Europe, Canada, Japan and Australia.
Source: https://www.etf.com/JXI
One concern about JXI is that its governance allows it to invest up to 20% of its assets in futures, options, swap contracts, cash and cash equivalents. That is quite high even if the derivatives are synthetic representations of the index. That means up to 20% of the fund may not be invested in assets that will yield dividend income for the investor. However, as of the writing of this article, JXI has over 99% of their assets invested in utilities while only 0.18% is invested in cash and/or derivatives.
2). The Tie for Second: XLU, VPU, and UTES
Image by Darby Browning from Pixabay
Basically, from an investment standpoint, XLU and VPU are the same ETF. They have the same expense ratio, the same volatility, the same 5-year stock performance, and the same yield. And of course this is the case. Even though they track different indices, they have the exact same top 10 holdings, in the exact same order of assets held. Now, each asset is held at different percentage of the portfolio, but these are such insignificant differences that its no wonder the ETFs are practically the same.
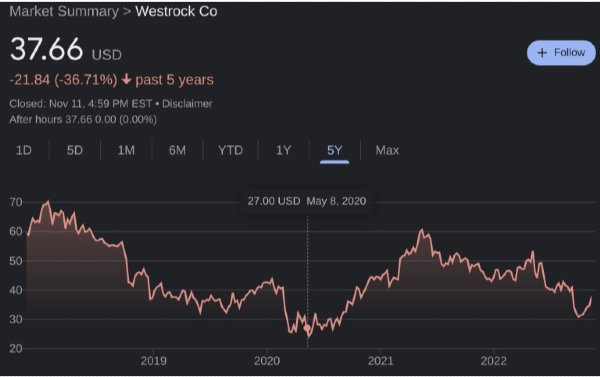
Source: Yahoo! Finance
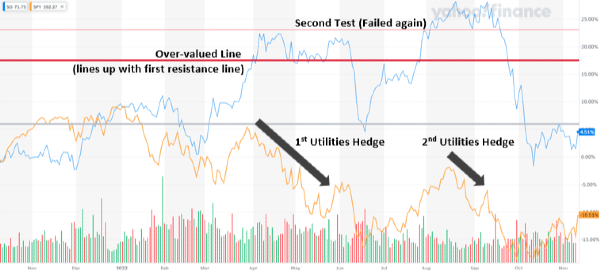
The Virtus Reaves utilities ETF (UTES) is a different consideration. UTES is the top ETF on this list in terms of APR and ranks well for volatility. Where UTES is by having a high expense ratio and a low yield. UTES is an actively managed ETF so its been able to hedge against the recent downturn in the stock market. This downturn has affected utilities even as they’ve been used as a hedge in the market, to see this phenomenon, read our article, Southern Company – A Buy but Not Without Risk. In the article, we can watch as Southern Company is used as a hedge, until the overall market falls below resistance lines. UTES is an ETF to consider as an actively managed alternative to XLU and VPU. While you have to pay a higher expense ratio you get a managed fund that has proven it can return a higher APR while keeping volatility low. Even though it is tied with VPU and XLU, if I had to choose, I would choose APR and volatility management over yield and expense ratio in this particular case. The higher expense ratio doesn’t offset the higher performance UTES has returned to its investors.
Utilities Select Sector SPDR Fund (XLU)
Vanguard Utilities Index Fund (VPU)
Virtus Reaves Utilities ETF (UTES)
3). Fidelity MSCI Utilities Index ETF (FUTY)
For all intents and purposes, FUTY is nearly interchangeable with XLU and VPU. It does have the lowest expense ratio of all the ETFs on this list, but its average in terms of the other parameters.
FUTY has nearly the same top 10 holdings as XLU and VPU. The only difference is that FUTY has WEC Energy Group Inc (WEC) in its top 10 while XLU and VPU have American Water Works (AWK).
From a retail investor’s perspective, investing in FUTY, XLU, or VPU are basically the same investment.
4). Invesco S&P SmallCap Utilities & Communication Services ETF (PSCU)
Unfortunately, even though PSCU made it as #4 on our list, it really is not the ETF for utility investors. Two stocks in its top 10 holdings include AMC Networks Inc (AMCX) and Shenandoah Telecommunications Co (SHEN). These holdings create a distinctly different investment profile for PSCU which stands out against the other typical Utility ETFs. While its drawdown is surprisingly low (likely due to a diversification into another sector), its 5-year APR is stagnant at 0.30%. Again, this is due to the spread of investments its investing in.
5). iShares U.S. Utilities ETF (IDU)
Long story short, you can get a better investment with XLU and VPU with a lower expense ratio. Except for Waste Management (WM), IDU has basically the same top 10 stocks as XLU and VPU. Waste Management is an understandable choice, but its typically considered an industrial stock.
For income, dividend, and utility investors, you’ll get an overall better investment with our other top options.
6). First Trust Utilities AlphaDEX Fund (FXU)
FXU is a equal weighted index. This gives it more exposure to mid-cap and small-cap utilities.
FXU (and our next ETF, RYU) is for investors looking for higher long-term gains and are okay going through more turbulence. FXU and RYU is not for retirement accounts, wealth preservation strategies, or pure income strategies.
7). Invesco S&P 500 Equal Weight Utilities ETF (RYU)
RYU does exactly what it’s meant to do as an investment. RYU is an equal weight ETF; this means it has more exposure to small-cap and mid-cap stocks. This increases the APR of the ETF, but also increases the volatility of the ETF.
RYU has one of the highest APRs on this list, but also is one of the lowest in terms of volatility metrics.
Invesco DWA Utilities Momentum ETF (PUI)
Image by 3D Animation Production Company from Pixabay
So in theory, a utility investment like this should have a very specific profile. Its APR should be high, its standard deviation should be high (which is fine in a momentum strategy), but its drawdown should be lower. The fund should be able to minimize drawdowns by detecting momentum changes in its procedure. Its max drawdown, though slightly better, is only minimally better than standard utility ETFs VPU and XLU. PUI is not performing as a momentum ETF, and hence isn’t worth the time or high expense ratio.
How we measure the Best Utility ETFs
Drawdown
Drawdown is the worse-case loss a stock feel during a given time interval. In this analysis we looked back 5 years. Check out our article on the safest utility stocks to invest in to learn more about drawdown.
Standard Deviation
Our analysis looks back at 5 years of daily stock changes (this is roughly 242 trading days a year). We take the standard deviation of those daily changes. Learn more about standard deviation in our article on the safest utility stocks to invest in.
Performance
For our analysis, we measured the annual rate of return of the ETF over the last five years.
Yield
Any dividends made by the ETF are passed through to the investor. This is the latest yield of the ETF. The yield will change based on the basket of stocks and instruments the ETF is composed of. ETFs that use derivatives to represent the index they follow may not receive dividends, lessening yield.
Expense Ratio
An expense ratio is the cost of running the fund as a percentage of total assets. Actively managed ETFs will typically require a higher expense ratio. The lower the expense ratio, the less you have to pay administrators and portfolio managers to have a basket of utility stocks.
Notes
Some exchange traded funds were not included in the list due to their high exposure to swaps and other derivative instruments. These ETFs include:
Further Readings - Stock Ideas
Further Readings - A Guide to Investing in Utilities