How to Invest Conservatively for Retirement
If you are retiring soon, you might wonder: how conservatively should I invest? What asset allocation should you have given sequence of return risk?
First, let’s look at a 50/50 portfolio’s historical returns. That’s a good place to start when talking about conservative investing in retirement.
If retiring in the next 5-10 years, you need to mitigate Sequence of Return Risk by de-risking.
Is it time to invest conservatively, given the historical returns of different asset allocations? Let’s start by discussing just what asset allocation means to you.
Define Asset Allocation in Retirement
This is for moderately advanced investors. Please click the links if you need a definition for Sequence of Return Risk or for Asset Allocation.
In brief, if you are drawing down on a portfolio with negative equity returns, there is a good chance of running out of assets in your retirement. While there are many ways to mitigate sequence of returns risk, one tried and true method is to make your asset allocation more conservative.
Historical 50/50 Portfolio Returns
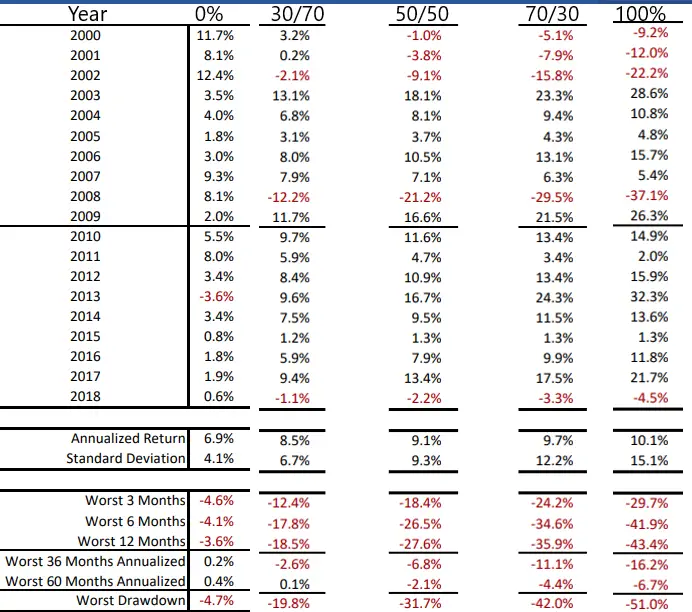
Look at recent history and see how a 50/50 asset allocation performs. If you are going conservative—de-risking—then a 50/50 portfolio is an excellent place to start. We can compare this to 0% and 100% equities and 30/70 and 70/30 portfolios.
 (50/50 Asset Allocation recent returns, annualized return, and worst drawdown)
Figure 1 is busy but informative.
Source
Years with Negative Returns since 2000
Note that there are 5 of 18 years when equities had negative returns.
A 100% treasury portfolio avoided all of those negative years but had a year (2013) with negative returns.
Our least aggressive asset allocation (30/70) avoided 2 of the five negative years, but both the 50/50 and the 70/30 suffered from negative returns in all 5 of the years.
Annualized Return
The annualized return (since 1970) for a 50/50 portfolio is 9.1%. This compares to 9.7% for 70/30 historical portfolio returns and 8.5% for a 30/70 portfolio historical returns. Are you surprised that the difference isn’t more significant?
Worst 3-, 6-, and 12-Month Return
You can look at these numbers yourself to compare the different asset allocations. Note how similar the worst 6- and 12-month returns are. On average, it doesn’t get much worse after a terrible six months.
Look now at the bottom of the figure next. Again, the worst drawdown is the percentage decrease from the top of the market to the bottom. But, again, after a dreadful six months, the market does not go down much more after that. Maybe that is a consideration for when to be greedy (when others are fearful) during corrections.
Worst 36- and 60-Month Annualized Returns
Finally, note the worst 3- and 5- year periods.
Since 1970, a 50/50 portfolio had a 3-year return of -6.8% and a 5-year return of -2.1%. Note how these returns compare to the other listed portfolios.
Modern Portfolio and 50/50 Portfolio Historical Returns
The historical numbers above are based on the S&P 500 and treasury bonds. History is nice to understand, lest we repeat it.
Today’s 50/50 asset allocation likely includes the modern portfolio theory. There are many ways to skin a cat and allocate your assets. Let’s look at one version of the modern portfolio and see what a conservative 50/50 portfolio looks like.
 (A Modern Portfolio with a conservative 50/50 Asset Allocation)
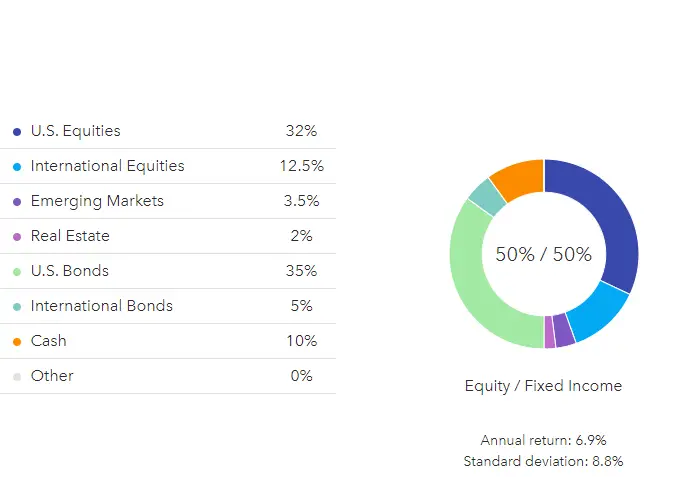
First, note the annual return of 6.9% and standard deviation of 8.8% in the bottom right corner of figure 1. From our historical results above, this compares to 9.1% and 9.3%, respectively.
Future expected returns are lower for a modern 50/50 portfolio than historical returns. Note, however, that the annual returns are not as disparate when you risk-adjust the returns when you take the standard deviation into account.
Instead of just being S&P 500 and treasure bonds, this version of a modern portfolio includes:
- 50% Equities (US, International, Emerging, Real Estate)
- 50% Fixed Income (US bonds, International bonds, Cash)
We can further break down the modern portfolio.
Modern Portfolio for a Conservative Asset Allocation
 (Further breakdown of the conservative asset allocation modern portfolio)
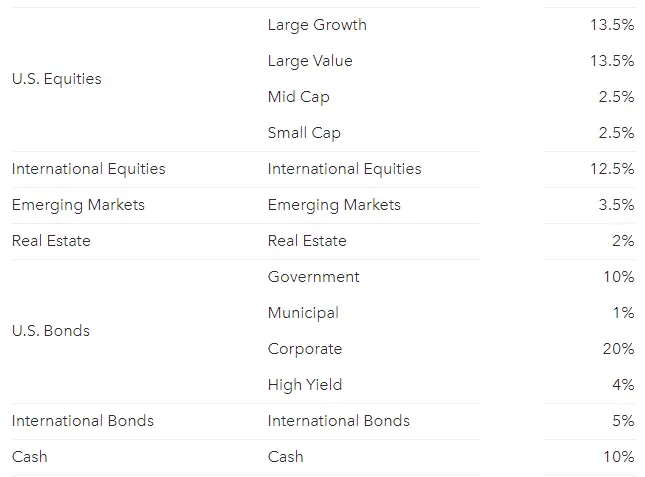
Above, US equities are further broken down into Large Growth and Large Value, with a small addition of Mid Cap and Small Cap.
Bonds in this conservative 50/50 portfolio include 20% Corporate, 10% Government, 4% High Yield, and 1% Municipal. This is not an example of what I would do, but it is one way to skin the asset allocation cat. Some might consider Bond Alternatives.
So, let’s get real. How can you get a 50/50 portfolio in your 401k?
How to Pick a 50/50 Portfolio in a 401k
I get asked: how do you choose the bonds in your 401k? After all, you might be 100% stocks in your brokerage account and Roth, so you need bonds in your 401k. So, look at a popular 401k provider and see how to build a 50/50 portfolio.
What mutual funds are available, and how do you choose which fund to invest in? How can I get to a 50/50 asset allocation in my employer’s 401k?
Why a 50/50 Portfolio?
It may just be that your personalized glidepath has you passing through 50/50 on your way back to a more aggressive portfolio later. Other folks have already won the game and don’t need more risk.
Regardless of the reason, let’s see what a 50/50 asset allocation looks like at a popular online 401k provider
Asset Allocation for a 50/50 Portfolio
 (My 50/50 stocks/fixed income Asset Allocation)
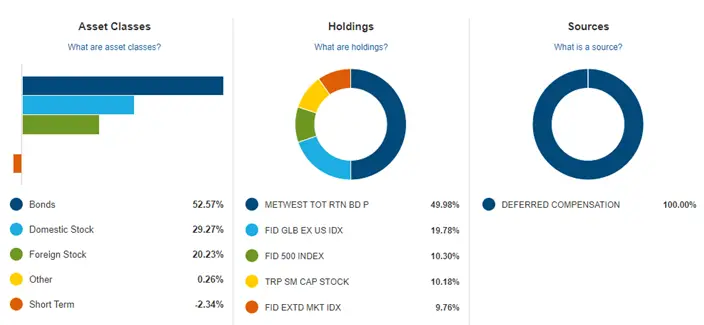
Above, you can see the asset allocation for my 50/50 portfolio at a popular online provider.
On the left, in more detail, my asset allocation is approximately 50% bonds, 30% US equities, and 20% international equities. Again, this mirrors a Boglehead 3 fund portfolio.
The actual funds utilized are broken out into portfolio percentages in the middle. I have about 50% invested in my plan’s only total bond fund option. This is an active bond fund with an average expense ratio. For the remaining 50%, I have 20% international and 10% each in large, mid, and small-cap investments. Regarding global equity, this is overweight US (as US equities are just over 50% of the total). This is overweight (or tilted) towards smaller and mid-sized companies regarding US equity.
Note on the right that this was all deferred compensation as the employer does not offer contributions to this account. They will appear here iHowever if you have employer (or post-tax!) contributions.
How did I get to this asset allocation? First, look at the options available to invest in my 401k plan.
Stock Funds Available in my 401k Plan
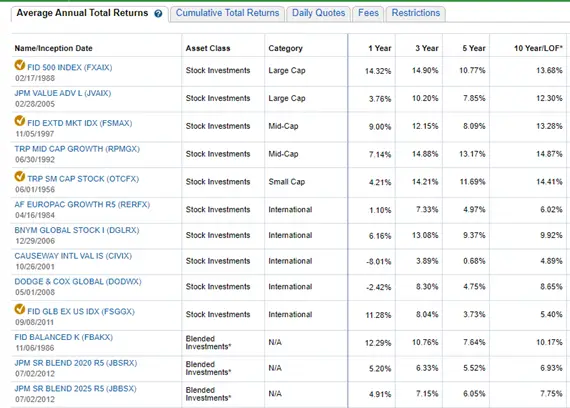 (Stock Funds Available)
You can see there are ten funds to choose from for equity exposure.
As you know, 401k plans are protected by ERISA, so employers limit the investment options to promote their fiduciary responsibility to you. As a result, just bread-and-butter options are available to employees; there are no crazy triple-leveraged ETFs!
So, when picking equities, should I look at the 1, 3, 5, or 10-year returns?
None of the above! Remember, past results don’t imply future returns!
You cannot control the returns of the market. You can only control the fees or expense ratios of what you invest. So, where are the expense ratios?
Expense Ratios
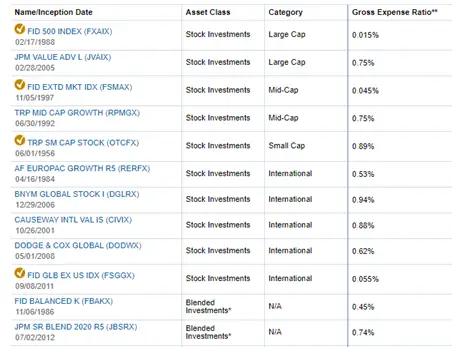 (Expense Ratios for Stock Funds in my 401k plan)
Above, you can see there are two Large Cap options. There is an inexpensive index fund and a somewhat more expensive value fund. There is a good index fund and an active growth fund for mid-caps.
There is only one small-cap option but five international options! So I picked the inexpensive, broadly diversified international fund and the expensive small-cap fund. I will talk about why I included small caps below.
Fixed Income options in my 401k plan
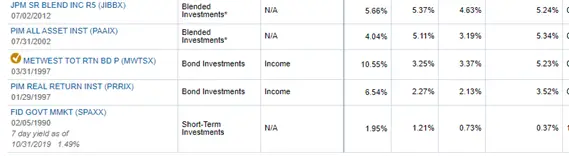 (Fixed Income (bond) options in my 401k plan)
Essentially there are only five options for fixed income. Above are two blended funds, two bond investments, and a money market fund.
As I have to pull out money in this account, don’t want target-date funds blended funds for my fixed income option. If all I own is a target-date fund or a blended fund, I have to sell the entire fund–stocks and bonds to get a distribution. So I want the ability to sell either stocks or bonds. This allows me to keep my asset allocation chosen level, depending on which funds I sell. Remember that de-accumulation is very different than accumulation!
Do pay attention to returns on bonds. As opposed to equities, where you cannot know future expected returns, current yields predict future expected returns for fixed income.
Fixed Income in a 50/50 Portfolio
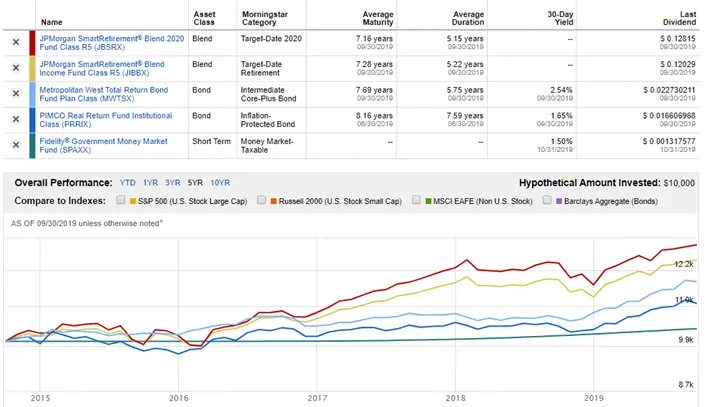 (Fixed Income and the 50/50 portfolio)
Above are five fixed-income options. The top two are target-date funds for 2020 and current retirees. These have equities in them, so you see their 5-year returns (in red and yellow) are quite a bit more volatile than the good bond funds. This is another reason you don’t want to mix equities and bonds in a distribution portfolio.
My three fixed-income options are: 1) an intermediate core-plus actively managed total bond fund, 2) an inflation-protected bond fund with low yields, and 3) a money market fund.
I might be in a money market fund if I needed all the funds next year. Of course, returns (in green) aren’t sexy, but they “never” lose their value.
Inflation is not a huge concern of mine in the short term, so I chose the higher-yielding bond fund for the next ~ ten years of this plan’s life.
Remember, the funds limit us in the 401k. So if you could choose any bonds fund, you’d want to pick one of these two.
So, that’s how you pick a 50/50 portfolio in a 401k. Let’s step back and summarize now.
Summary: Historical Returns of a 50/50 Portfolio
If you are drawing down on your portfolio in the next 5-10 years, you must pay attention to known Risks. For example, what should your asset allocation be five years from retirement?
Above, we see the historical returns of a 50/50 portfolio and compare them to slightly more or less aggressive asset allocations. Next, see the 70/30 portfolio historical returns and the 30/70 portfolio historical returns. Finally, you can see the worst-case scenarios.
In addition, I also demonstrate a version of a modern portfolio to show how you can portion asset allocation. There are many different ways to allocate your portfolio, and you can be as simple (Bogleheads 3-Fund Portfolio) or as complicated (Merriman’s Ultimate Buy and Hold Portfolio) as you wish.
Sequence of Return Risk is inevitable when withdrawing from retirement accounts. So plan your pre-retirement glidepath and “go conservative.” You can be in the game for the long haul with a conservative asset allocation.


How to Invest Conservatively for Retirement
If you are retiring soon, you might wonder: how conservatively should I invest? What asset allocation should you have given sequence of return risk?
First, let’s look at a 50/50 portfolio’s historical returns. That’s a good place to start when talking about conservative investing in retirement.
If retiring in the next 5-10 years, you need to mitigate Sequence of Return Risk by de-risking.
Is it time to invest conservatively, given the historical returns of different asset allocations? Let’s start by discussing just what asset allocation means to you.
Define Asset Allocation in Retirement
This is for moderately advanced investors. Please click the links if you need a definition for Sequence of Return Risk or for Asset Allocation.
In brief, if you are drawing down on a portfolio with negative equity returns, there is a good chance of running out of assets in your retirement. While there are many ways to mitigate sequence of returns risk, one tried and true method is to make your asset allocation more conservative.
Historical 50/50 Portfolio Returns
Look at recent history and see how a 50/50 asset allocation performs. If you are going conservative—de-risking—then a 50/50 portfolio is an excellent place to start. We can compare this to 0% and 100% equities and 30/70 and 70/30 portfolios. (50/50 Asset Allocation recent returns, annualized return, and worst drawdown)
Figure 1 is busy but informative.
Source
Years with Negative Returns since 2000
Note that there are 5 of 18 years when equities had negative returns.
A 100% treasury portfolio avoided all of those negative years but had a year (2013) with negative returns.
Our least aggressive asset allocation (30/70) avoided 2 of the five negative years, but both the 50/50 and the 70/30 suffered from negative returns in all 5 of the years.
Annualized Return
The annualized return (since 1970) for a 50/50 portfolio is 9.1%. This compares to 9.7% for 70/30 historical portfolio returns and 8.5% for a 30/70 portfolio historical returns. Are you surprised that the difference isn’t more significant?
Worst 3-, 6-, and 12-Month Return
You can look at these numbers yourself to compare the different asset allocations. Note how similar the worst 6- and 12-month returns are. On average, it doesn’t get much worse after a terrible six months.
Look now at the bottom of the figure next. Again, the worst drawdown is the percentage decrease from the top of the market to the bottom. But, again, after a dreadful six months, the market does not go down much more after that. Maybe that is a consideration for when to be greedy (when others are fearful) during corrections.
Worst 36- and 60-Month Annualized Returns
Finally, note the worst 3- and 5- year periods.
Since 1970, a 50/50 portfolio had a 3-year return of -6.8% and a 5-year return of -2.1%. Note how these returns compare to the other listed portfolios.
Modern Portfolio and 50/50 Portfolio Historical Returns
The historical numbers above are based on the S&P 500 and treasury bonds. History is nice to understand, lest we repeat it.
Today’s 50/50 asset allocation likely includes the modern portfolio theory. There are many ways to skin a cat and allocate your assets. Let’s look at one version of the modern portfolio and see what a conservative 50/50 portfolio looks like. (A Modern Portfolio with a conservative 50/50 Asset Allocation)
First, note the annual return of 6.9% and standard deviation of 8.8% in the bottom right corner of figure 1. From our historical results above, this compares to 9.1% and 9.3%, respectively.
Future expected returns are lower for a modern 50/50 portfolio than historical returns. Note, however, that the annual returns are not as disparate when you risk-adjust the returns when you take the standard deviation into account.
Instead of just being S&P 500 and treasure bonds, this version of a modern portfolio includes:
We can further break down the modern portfolio.
Modern Portfolio for a Conservative Asset Allocation
Above, US equities are further broken down into Large Growth and Large Value, with a small addition of Mid Cap and Small Cap.
Bonds in this conservative 50/50 portfolio include 20% Corporate, 10% Government, 4% High Yield, and 1% Municipal. This is not an example of what I would do, but it is one way to skin the asset allocation cat. Some might consider Bond Alternatives.
So, let’s get real. How can you get a 50/50 portfolio in your 401k?
How to Pick a 50/50 Portfolio in a 401k
I get asked: how do you choose the bonds in your 401k? After all, you might be 100% stocks in your brokerage account and Roth, so you need bonds in your 401k. So, look at a popular 401k provider and see how to build a 50/50 portfolio.
What mutual funds are available, and how do you choose which fund to invest in? How can I get to a 50/50 asset allocation in my employer’s 401k?
Why a 50/50 Portfolio?
It may just be that your personalized glidepath has you passing through 50/50 on your way back to a more aggressive portfolio later. Other folks have already won the game and don’t need more risk.
Regardless of the reason, let’s see what a 50/50 asset allocation looks like at a popular online 401k provider
Asset Allocation for a 50/50 Portfolio
Above, you can see the asset allocation for my 50/50 portfolio at a popular online provider.
On the left, in more detail, my asset allocation is approximately 50% bonds, 30% US equities, and 20% international equities. Again, this mirrors a Boglehead 3 fund portfolio.
The actual funds utilized are broken out into portfolio percentages in the middle. I have about 50% invested in my plan’s only total bond fund option. This is an active bond fund with an average expense ratio. For the remaining 50%, I have 20% international and 10% each in large, mid, and small-cap investments. Regarding global equity, this is overweight US (as US equities are just over 50% of the total). This is overweight (or tilted) towards smaller and mid-sized companies regarding US equity.
Note on the right that this was all deferred compensation as the employer does not offer contributions to this account. They will appear here iHowever if you have employer (or post-tax!) contributions.
How did I get to this asset allocation? First, look at the options available to invest in my 401k plan.
Stock Funds Available in my 401k Plan
You can see there are ten funds to choose from for equity exposure.
As you know, 401k plans are protected by ERISA, so employers limit the investment options to promote their fiduciary responsibility to you. As a result, just bread-and-butter options are available to employees; there are no crazy triple-leveraged ETFs!
So, when picking equities, should I look at the 1, 3, 5, or 10-year returns?
None of the above! Remember, past results don’t imply future returns!
You cannot control the returns of the market. You can only control the fees or expense ratios of what you invest. So, where are the expense ratios?
Expense Ratios
Above, you can see there are two Large Cap options. There is an inexpensive index fund and a somewhat more expensive value fund. There is a good index fund and an active growth fund for mid-caps.
There is only one small-cap option but five international options! So I picked the inexpensive, broadly diversified international fund and the expensive small-cap fund. I will talk about why I included small caps below.
Fixed Income options in my 401k plan
Essentially there are only five options for fixed income. Above are two blended funds, two bond investments, and a money market fund.
As I have to pull out money in this account, don’t want target-date funds blended funds for my fixed income option. If all I own is a target-date fund or a blended fund, I have to sell the entire fund–stocks and bonds to get a distribution. So I want the ability to sell either stocks or bonds. This allows me to keep my asset allocation chosen level, depending on which funds I sell. Remember that de-accumulation is very different than accumulation!
Do pay attention to returns on bonds. As opposed to equities, where you cannot know future expected returns, current yields predict future expected returns for fixed income.
Fixed Income in a 50/50 Portfolio
Above are five fixed-income options. The top two are target-date funds for 2020 and current retirees. These have equities in them, so you see their 5-year returns (in red and yellow) are quite a bit more volatile than the good bond funds. This is another reason you don’t want to mix equities and bonds in a distribution portfolio.
My three fixed-income options are: 1) an intermediate core-plus actively managed total bond fund, 2) an inflation-protected bond fund with low yields, and 3) a money market fund.
I might be in a money market fund if I needed all the funds next year. Of course, returns (in green) aren’t sexy, but they “never” lose their value.
Inflation is not a huge concern of mine in the short term, so I chose the higher-yielding bond fund for the next ~ ten years of this plan’s life.
Remember, the funds limit us in the 401k. So if you could choose any bonds fund, you’d want to pick one of these two.
So, that’s how you pick a 50/50 portfolio in a 401k. Let’s step back and summarize now.
Summary: Historical Returns of a 50/50 Portfolio
If you are drawing down on your portfolio in the next 5-10 years, you must pay attention to known Risks. For example, what should your asset allocation be five years from retirement?
Above, we see the historical returns of a 50/50 portfolio and compare them to slightly more or less aggressive asset allocations. Next, see the 70/30 portfolio historical returns and the 30/70 portfolio historical returns. Finally, you can see the worst-case scenarios.
In addition, I also demonstrate a version of a modern portfolio to show how you can portion asset allocation. There are many different ways to allocate your portfolio, and you can be as simple (Bogleheads 3-Fund Portfolio) or as complicated (Merriman’s Ultimate Buy and Hold Portfolio) as you wish.
Sequence of Return Risk is inevitable when withdrawing from retirement accounts. So plan your pre-retirement glidepath and “go conservative.” You can be in the game for the long haul with a conservative asset allocation.
Originally Posted in FiPhysician