How to Interpret Price to Earnings (P/E) ratio
The Price to Earnings ratio tells the investor how many years it will take for a company’s earnings to equal the current stock price. You can see this when we simplify the formula:
$ Price of Stock per Share / $ Earnings per share per year =
$ price of Stock / ($ Earnings / year) =
($ price of Stock / $ Earnings) * years =
years!
In this equation, the “dollars” and the “per shares” cancel out, leaving only the years.
A P/E ratio of 7 means that it will take seven years for earnings to accumulate enough to match the current price. This assumes that earnings will not change. If investors assume future earnings will go down, the P/E ratio will tend to be lower. If investors assume future earnings will go up, the P/E ratio will tend to be higher.
What is a good Price to Earnings (P/E) ratio?
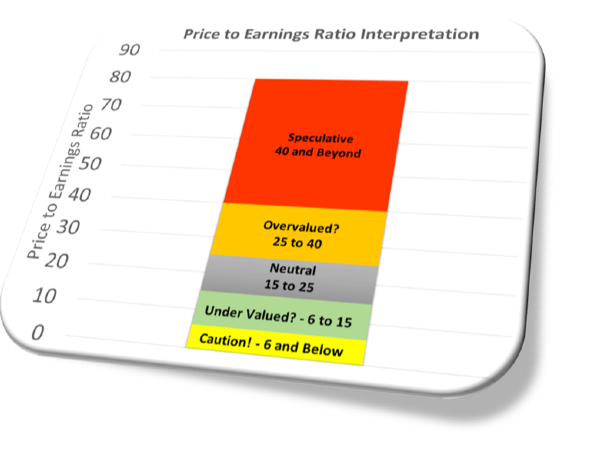
We’ve broken down the price to earnings ratio into different ranges.
A P/E ratio of 6 or below
If a P/E ratio is 6 or less, be cautious! Do not assume a low P/E ratio means the company is undervalued. A low P/E ratio like this does not always indicate a buying opportunity. A low P/E ratio may mean:
- The company had a one-time earnings windfall. This could be a legal win or a sell-off of production assets or a number of other various reasons you must do research on.
- The rest of the market has priced in future under performance of earnings
- A sell-off of capital equipment. This would create a one-time earnings increase, but future under performance of earnings due to a loss of production
- A market crash
During a market crash, a low P/E ratio may mean a company is undervalued. This should be a macro-level event. Any other time, you should be cautious and take time to understand the company’s financial health. There is likely a financial anomaly causing the low P/E ratio.
A P/E ratio of 6 to 15
A P/E ratio in the range of 6 to 15 generally indicates a potential investment opportunity. However, in investing, nothing is ever a sure thing so conduct further research on the stock before investing. The P/E ratio maybe in this range for the following reasons:
- You’re in the middle of a market crash or recovery
- The stock’s sector is undervalued. This happens when capital is limited and focused on other stock sectors. For example, Utilities will tend to be undervalued when Technology stocks are appreciating
- The market is concerned due to other aspects of the business. This could be the company’s debt, book value, or future earnings potential, to name a few examples.
A P/E ratio of 15 to 25
At these levels, the stock is "neutral". Non-growth stocks tend to stay in this range. In this range, the market is likely valuing the company correctly. Stocks that stay in this range typically have stable business operations and plans. They typically are setting goals the market likes and meeting those goals. Stocks in the neutral zone typically have dividends that help make them attractive to investors.
A P/E ratio of 25 to 40
A P/E ratio in the range of 25 to 40 generally indicates the stock is overvalued. If the stock is considered to be a growth stock, then the market is paying a higher price for future earnings growth. This means a growth stock may even be undervalued in this range. For a typical stock, the stock may be overvalued for the following reasons.
The Fog of War. The market is only as efficient as the human’s operating in it. And no one has a crystal ball. A P/E ratio this high on a non-growth stock could mean that investors have diverging opinions about the company’s future opportunities and growth.
Buyout Potential. If investors start putting the pieces together, they can make a pretty good educated guess if a buyout is imminent. When a buyout occurs, the buyer will typically pay a per share price higher than the price before the buyout is announced.
Too much capital in the stock. Believe it or not, large funds sometimes just need to park their capital somewhere. These funds may be putting money into baskets of stocks or ETFs without too much more consideration.
Market Momentum. Momentum traders may be helping to drive the stock up as they start getting signals. These signals are driven by market participant emotions, which momentum investors see in certain technical patterns. People may not even be looking at the P/E ratios before investing.
Speculative – 40 and Beyond
A P/E ratio in the range of 40 and Beyond is Speculative. Technology companies and hyper growth stocks will live in these ranges. Though technology stocks have proven they warrant a high P/E ratio, the basis for their high price comes purely from future opportunity. The key reasons why a P/E ratio is this high is that:
• The company has a lot of speculation around its growth. Remember, for every Microsoft, there is a pets.com
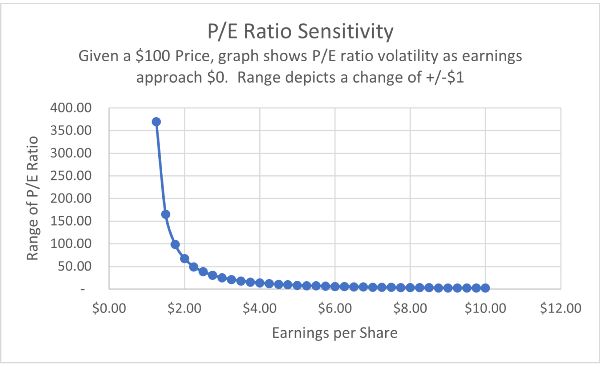
• Earnings are too low. If earnings are too low, then the price to earnings ratio is very volatile. In the chart below, the x-axis shows earnings per share. The y-axis shows the range of P/E ratios if earnings per share changes by $1/share. As earnings approach near $0.00, the P/E ratio will increase substantially. Once this occurs, the P/E ratio becomes meaningless.
Other Questions About the P/E Ratio
What is a Negative PE ratio?
A stock with a negative PE ratio has negative earnings. This means, from an accounting standpoint, the company wasn’t profitable in the trailing four quarters. This isn’t always bad. Technology companies will have negative earnings as they are reinvesting all their profit into further growth.
Is a High or Low PE Ratio Better?
A price to earnings ratio between 6 to 15 is the best. Lower than 6 and the stock may have underlying financial issues skewing the ratio. Higher than 15 and the stock could be over-valued or investors are speculating on the stock.
Why is the P/E ratio Important?
The P/E ratio gives an investor a quick snapshot of the valuation of the stock. It should not be used as a significant stock screener or the final decision point when buying or selling a stock.
Why is the P/E Ratio Shown as Not-Applicable (N/A)?
When a price to earnings ratio is less than zero, many times financial media data will return an N/A. When a company has negative earnings, the price to earnings ratio is negative and hence has no meaning. What the N/A is telling you here is that the P/E ratio is not useful when assessing the company with the given ratio.
In this case, you must evaluate the company based on its future potential earnings. This means evaluating the companies vision and also its cash position.


















How to Interpret Price to Earnings (P/E) ratio
The Price to Earnings ratio tells the investor how many years it will take for a company’s earnings to equal the current stock price. You can see this when we simplify the formula:
$ Price of Stock
per Share/ $ Earningsper shareper year =$ price of Stock / ($ Earnings / year) =
(
$ price of Stock/$ Earnings) * years =years!
In this equation, the “dollars” and the “per shares” cancel out, leaving only the years.
A P/E ratio of 7 means that it will take seven years for earnings to accumulate enough to match the current price. This assumes that earnings will not change. If investors assume future earnings will go down, the P/E ratio will tend to be lower. If investors assume future earnings will go up, the P/E ratio will tend to be higher.
What is a good Price to Earnings (P/E) ratio?
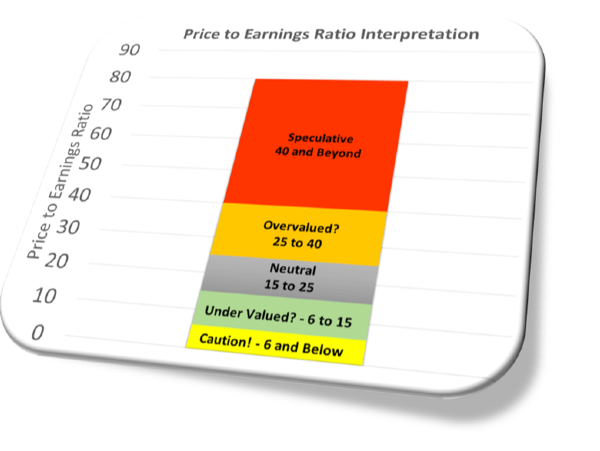
We’ve broken down the price to earnings ratio into different ranges.
A P/E ratio of 6 or below
If a P/E ratio is 6 or less, be cautious! Do not assume a low P/E ratio means the company is undervalued. A low P/E ratio like this does not always indicate a buying opportunity. A low P/E ratio may mean:
During a market crash, a low P/E ratio may mean a company is undervalued. This should be a macro-level event. Any other time, you should be cautious and take time to understand the company’s financial health. There is likely a financial anomaly causing the low P/E ratio.
A P/E ratio of 6 to 15
A P/E ratio in the range of 6 to 15 generally indicates a potential investment opportunity. However, in investing, nothing is ever a sure thing so conduct further research on the stock before investing. The P/E ratio maybe in this range for the following reasons:
A P/E ratio of 15 to 25
At these levels, the stock is "neutral". Non-growth stocks tend to stay in this range. In this range, the market is likely valuing the company correctly. Stocks that stay in this range typically have stable business operations and plans. They typically are setting goals the market likes and meeting those goals. Stocks in the neutral zone typically have dividends that help make them attractive to investors.
A P/E ratio of 25 to 40
A P/E ratio in the range of 25 to 40 generally indicates the stock is overvalued. If the stock is considered to be a growth stock, then the market is paying a higher price for future earnings growth. This means a growth stock may even be undervalued in this range. For a typical stock, the stock may be overvalued for the following reasons.
The Fog of War. The market is only as efficient as the human’s operating in it. And no one has a crystal ball. A P/E ratio this high on a non-growth stock could mean that investors have diverging opinions about the company’s future opportunities and growth.
Buyout Potential. If investors start putting the pieces together, they can make a pretty good educated guess if a buyout is imminent. When a buyout occurs, the buyer will typically pay a per share price higher than the price before the buyout is announced.
Too much capital in the stock. Believe it or not, large funds sometimes just need to park their capital somewhere. These funds may be putting money into baskets of stocks or ETFs without too much more consideration.
Market Momentum. Momentum traders may be helping to drive the stock up as they start getting signals. These signals are driven by market participant emotions, which momentum investors see in certain technical patterns. People may not even be looking at the P/E ratios before investing.
Speculative – 40 and Beyond
A P/E ratio in the range of 40 and Beyond is Speculative. Technology companies and hyper growth stocks will live in these ranges. Though technology stocks have proven they warrant a high P/E ratio, the basis for their high price comes purely from future opportunity. The key reasons why a P/E ratio is this high is that:
• The company has a lot of speculation around its growth. Remember, for every Microsoft, there is a pets.com
• Earnings are too low. If earnings are too low, then the price to earnings ratio is very volatile. In the chart below, the x-axis shows earnings per share. The y-axis shows the range of P/E ratios if earnings per share changes by $1/share. As earnings approach near $0.00, the P/E ratio will increase substantially. Once this occurs, the P/E ratio becomes meaningless.
Other Questions About the P/E Ratio
What is a Negative PE ratio?
A stock with a negative PE ratio has negative earnings. This means, from an accounting standpoint, the company wasn’t profitable in the trailing four quarters. This isn’t always bad. Technology companies will have negative earnings as they are reinvesting all their profit into further growth.
Is a High or Low PE Ratio Better?
A price to earnings ratio between 6 to 15 is the best. Lower than 6 and the stock may have underlying financial issues skewing the ratio. Higher than 15 and the stock could be over-valued or investors are speculating on the stock.
Why is the P/E ratio Important?
The P/E ratio gives an investor a quick snapshot of the valuation of the stock. It should not be used as a significant stock screener or the final decision point when buying or selling a stock.
Why is the P/E Ratio Shown as Not-Applicable (N/A)?
When a price to earnings ratio is less than zero, many times financial media data will return an N/A. When a company has negative earnings, the price to earnings ratio is negative and hence has no meaning. What the N/A is telling you here is that the P/E ratio is not useful when assessing the company with the given ratio.
In this case, you must evaluate the company based on its future potential earnings. This means evaluating the companies vision and also its cash position.